REIT ETFs
Six core funds comparedA research hub for the best REIT ETFs and REIT ETF comparisons: VNQ, SCHH, IYR, XLRE, USRT and FREL. This REIT ETF comparison shows what each fund holds, what it costs, what it pays and how much of its portfolio it shares with the others. Every comparison page carries dated figures and sources.
Fund data from Vanguard, iShares, Schwab, State Street and Fidelity pages and StockAnalysis, Jul 31 to Nov 9, 2026 · Educational research, not advice
REIT ETFs at a glance
Six things to know first- Heavy overlap. REIT ETFs draw from the same pool of listed property companies, so the six share 69% to 94% of their weight.
- Cost range. The six REIT ETFs here charge between 0.07% and 0.37%, so cost differs by $300 a year on $100,000.
- Different definitions. IYR holds mortgage REITs, USRT holds no cell towers and XLRE holds only about 30 stocks.
- Income. Trailing 12-month yields ran from 2.51% to 3.50%, and REITs must pay out most of their taxable income.
- A hard stretch. The six REIT ETFs lost 24.4% to 26.2% in 2022, and five-year annualized returns ran only 1.3% to 3.7%.
- Rates matter. REIT prices are sensitive to interest rates, so they can move with bonds as well as with stocks.
Core REIT ETFs, the six funds side by side
Dated figures, sources on each comparison| VNQ | SCHH | IYR | XLRE | USRT | FREL | |
|---|---|---|---|---|---|---|
| Fund | Vanguard Real Estate ETF | Schwab U.S. REIT ETF | iShares U.S. Real Estate ETF | Real Estate Select Sector SPDR Fund | iShares Core U.S. REIT ETF | Fidelity MSCI Real Estate Index ETF |
| Holds | MSCI US real estate, all sizes | Equity REITs only | Real estate incl. mortgage REITs | About 30 large real estate stocks | Equity REITs, no cell towers | MSCI US real estate, all sizes |
| Index | MSCI US IMI/Real Estate 25-50 Index | Dow Jones Equity All REIT Capped Index | Dow Jones U.S. Real Estate Capped Index | S&P Real Estate Select Sector Index | FTSE Nareit Equity REITs 40 Act Capped Index | MSCI US IMI/Real Estate 25-25 Index |
| Expense ratio | 0.13% | 0.07% | 0.37% | 0.08% | 0.08% | 0.084% |
| Trailing 12-month yield | 3.50% (Nov 9) | 3.08% (Sep 30, 2026) | 2.51% (Sep 30, 2026) | 3.23% (Nov 9) | 2.85% (Sep 30, 2026) | 3.29% (Nov 9) |
| Paid per share, last 12 months | $3.41 | $0.68 | $2.39 | $1.44 | $1.75 | $0.97 |
| Payout schedule | Quarterly | Quarterly | Quarterly | Quarterly | Quarterly | Quarterly |
| Stocks held | 139 | 120 | 58 | 30 | 122 | 126 |
| Ten largest holdings | 56.1% (Sep 30, 2026) | 51.4% (Nov 6, 2026) | 52.9% (Nov 9, 2026) | 59.4% (Nov 6, 2026) | 50.5% (Nov 6, 2026) | 48.0% (Jul 31, 2026) |
| Net assets | $38.62B (Nov 9) | $11.39B (Nov 9) | $4.01B (Nov 9) | $8.50B (Nov 9) | $4.29B (Nov 9) | $1.35B (Sep 30) |
| Launched | 2004 | 2011 | 2000 | 2015 | 2007 | 2015 |
Dates differ by issuer and are shown in brackets, so compare the shape of each row, not the decimals. The trailing 12-month yield is shown for all six so the funds use one measure. VNQ’s net assets are for the ETF share class only ($38.62B on Nov 9); Vanguard’s figure for all share classes combined is larger. FREL’s figure is the latest on its fact sheet. VNQ’s ten largest holdings include its holding of another Vanguard REIT fund.
SCHH is the lowest-cost fund at 0.07%. XLRE and USRT follow at 0.08%, then FREL at 0.084%, VNQ at 0.13% and IYR at 0.37%. The more useful differences are what each fund includes and how many stocks it holds, from 30 for XLRE to 139 for VNQ.
Best REIT ETFs, fund by fund
What each one is and where it differsVNQ
Vanguard Real Estate ETF is the largest of the six, launched in 2004. It follows the MSCI US IMI Real Estate 25/50 Index, holds 139 stocks and charges 0.13%. It had $38.62B in the ETF share class on Nov 9, 2026. About 14.6% of its assets sit in another Vanguard fund that itself holds REITs, which makes the fund look more concentrated than its REIT exposure is. The ten largest holdings made up 56.1%.
SCHH
Schwab U.S. REIT ETF follows the Dow Jones Equity All REIT Capped Index and holds 120 stocks, equity REITs only. It charges 0.07%, the lowest of the six, and had $11.39B on Nov 9, 2026. The ten largest holdings made up 51.4%.
IYR
iShares U.S. Real Estate ETF follows the Dow Jones U.S. Real Estate Capped Index and holds 58 stocks. It charges 0.37%, the highest of the six, and had $4.01B on Nov 9, 2026. It is the only fund here with mortgage REITs, and it also holds real estate service companies. The ten largest holdings made up 52.9%.
XLRE
Real Estate Select Sector SPDR Fund follows the S&P Real Estate Select Sector Index and holds only 30 stocks, the real estate sector of the S&P 500. It charges 0.08% and had $8.50B on Nov 9, 2026. The ten largest holdings made up 59.4%, the largest share of the six.
USRT
iShares Core U.S. REIT ETF follows the FTSE Nareit Equity REITs 40 Act Capped Index and holds 122 stocks. It charges 0.08% and had $4.29B on Nov 9, 2026. It holds no cell tower REITs. The ten largest holdings made up 50.5%.
FREL
Fidelity MSCI Real Estate Index ETF follows the MSCI US IMI Real Estate 25/25 Index and holds 126 stocks. It charges 0.084% and is the smallest of the six at $1.35B on Sep 30, 2026. The ten largest holdings made up 48.0%.
REIT ETFs, what they hold and what they leave out
Equity REITs, mortgage REITs and real estate servicesREIT ETFs look alike on a ticker list but differ in what counts as real estate. SCHH and USRT hold equity REITs, companies that own buildings and land and collect rent. VNQ and FREL follow MSCI indexes that cover the whole U.S. real estate sector, so they also hold real estate service companies such as CBRE. XLRE holds only the real estate stocks inside the S&P 500.
IYR goes furthest. Its index takes in mortgage REITs, which own property loans and mortgage bonds instead of buildings and respond to interest rates differently. In the holdings file compared here, IYR held Annaly, AGNC, Rithm and Starwood, which no other fund in the group holds in meaningful size.
USRT is the opposite case. Its index holds no American Tower, Crown Castle or SBA Communications, so it misses the cell tower REITs entirely. The other five hold between 7.5% and 12.2% in towers.
When SCHH or USRT fits: you want equity REITs only, at a low cost. When VNQ or FREL fits: you want the whole real estate sector, large to small. When XLRE fits: you want the large-company slice and accept a 30-stock fund. When IYR fits: you want mortgage REITs included on purpose. These describe what the funds hold, not recommendations.
REIT index rules, why similar funds differ
Why the funds hold different stocksEvery REIT fund has to answer two questions: which companies count as real estate, and how much of the largest ones to hold. MSCI and Dow Jones cap the weight of the biggest companies, so the largest names cannot take over the fund. FTSE Nareit limits the index to tax-qualified equity REITs. S&P selects the real estate sector of the S&P 500.
The effect on sector mix is modest. Using one property-type scheme applied to every fund’s full holdings, health care was the largest group in all six, from 16.3% in FREL to 19.1% in USRT, and retail was second in all six. Cell towers made up 12.2% of XLRE and nothing in USRT.
The funds do not measure valuation on the same date or by the same method, so compare direction rather than decimals. Price-to-book ratios ran from 2.31 for USRT to 2.71 for XLRE on the dated figures used here.
| Fund | Largest property types | Holdings date |
|---|---|---|
| VNQ | Health care 17.9%, Retail 14.4%, Industrial 11.3% | Sep 30, 2026 |
| SCHH | Health care 18.5%, Retail 16.6%, Industrial 11.3% | Nov 6, 2026 |
| IYR | Health care 17.7%, Retail 13.9%, Residential 11.3% | Nov 9, 2026 |
| XLRE | Health care 17.6%, Retail 13.5%, Cell towers 12.2% | Nov 6, 2026 |
| USRT | Health care 19.1%, Retail 18.4%, Residential 13.6% | Nov 6, 2026 |
| FREL | Health care 16.3%, Retail 15.6%, Industrial 11.2% | Jul 31, 2026 |
Property-type shares are computed from each fund’s full holdings file using one scheme for every fund, so they are comparable across funds but will not match each issuer’s own sector table. Holdings dates differ, and FREL’s come from its SEC filing dated Jul 31, 2026. VNQ’s weights exclude its holding of another Vanguard REIT fund and are scaled to the stocks it holds directly.
REIT ETF returns, same dates for all six
Market price total return to Nov 9, 2026Issuers report returns to different month-ends, which makes a side-by-side table misleading. To fix that, every figure below is a market price total return computed from daily adjusted closing prices on the same dates, with distributions reinvested. The one-, three- and five-year figures end on Nov 9, 2026. Figures for 3, 5 and 10 years are annualized.
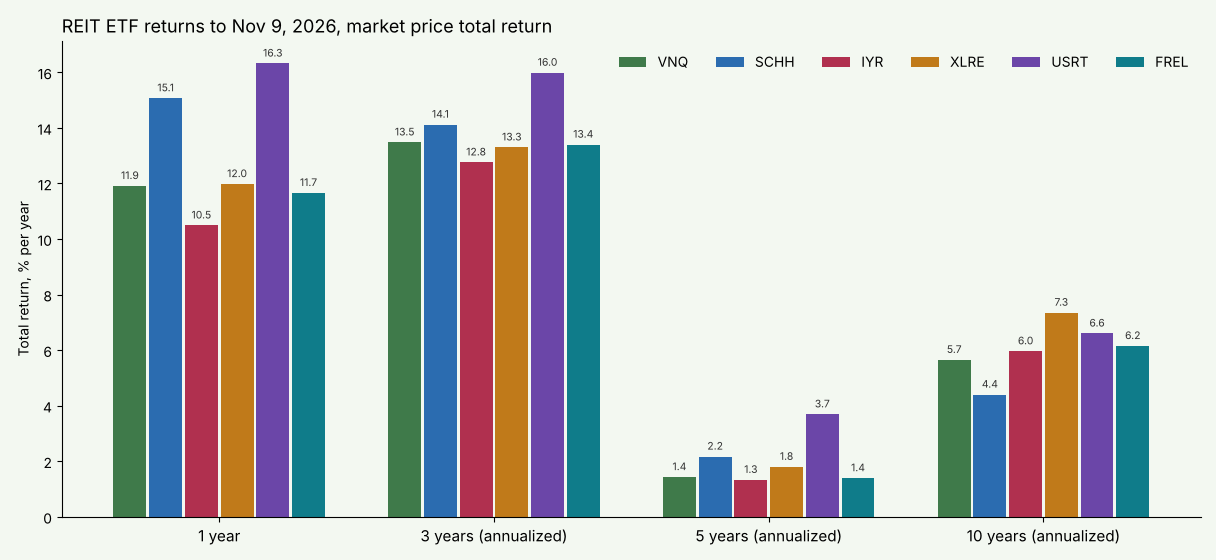
| Fund | 1 year | 3 years | 5 years | 10 years | Year to date | 2022 | 2023 | 2024 | 2025 |
|---|---|---|---|---|---|---|---|---|---|
| VNQ | 11.91% | 13.48% | 1.43% | 5.65% | 13.08% | -26.25% | 11.85% | 4.81% | 3.24% |
| SCHH | 15.07% | 14.12% | 2.17% | 4.40% | 16.53% | -24.99% | 11.18% | 4.99% | 2.20% |
| IYR | 10.49% | 12.76% | 1.33% | 5.96% | 11.57% | -25.51% | 11.89% | 4.41% | 3.38% |
| XLRE | 11.98% | 13.30% | 1.80% | 7.35% | 13.30% | -26.25% | 12.36% | 5.09% | 2.63% |
| USRT | 16.32% | 15.99% | 3.69% | 6.60% | 18.10% | -24.43% | 13.64% | 8.58% | 2.44% |
| FREL | 11.66% | 13.40% | 1.39% | 6.15% | 12.87% | -26.21% | 11.74% | 5.05% | 3.09% |
Source: StockAnalysis daily price history, adjusted for distributions, computed Nov 9, 2026. These are market price returns, not issuer NAV returns, and they exclude your own taxes and costs. The 10-year figure runs from the Dec 30, 2016 close. Past performance does not guarantee future results.
Over the last year USRT led the group at 16.32% and IYR trailed at 10.49%. Over three years the six sat in a narrow band, from 12.76% for IYR to 15.99% for USRT, annualized. Over five years the range was only 1.33% to 3.69% a year, a reminder of how hard 2022 hit. In 2022 the six lost between 24.43% for USRT and 26.25% for VNQ and XLRE, and USRT led in 2023 and 2024.
Over 10 years XLRE led at 7.35% a year and SCHH trailed at 4.40%. Each comparison page repeats this table for its own two funds and also shows the issuers’ own NAV returns with their dates where the issuer reports them. Read how to measure investment growth for how to read returns correctly.
REIT ETF yield and dividends
Payouts per share, last 12 months against the 12 beforeREIT ETFs pay more than the average stock fund because REITs must distribute most of their taxable income. All six pay quarterly, and the amounts move from quarter to quarter with property income. VNQ pays the most per share and SCHH the least, but that mostly reflects share price.
The fair comparison is the total paid over a full 12 months against the 12 months before, counted by ex-dividend date. The table below does that for all six funds using the payout histories on StockAnalysis.
| Fund | Payout schedule | Paid per share, 12 months to Nov 9, 2026 | Paid per share, prior 12 months | Change |
|---|---|---|---|---|
| VNQ | Quarterly | $3.41 | $3.53 | -3.4% |
| SCHH | Quarterly | $0.68 | $0.65 | +4.6% |
| IYR | Quarterly | $2.39 | $2.27 | +5.3% |
| XLRE | Quarterly | $1.44 | $1.39 | +3.6% |
| USRT | Quarterly | $1.75 | $1.56 | +12.2% |
| FREL | Quarterly | $0.97 | $0.97 | +0.0% |
Per-share dollars differ because share prices differ, so compare yields across funds and use the dollar change only within one fund. Source: StockAnalysis dividend history (Nov 9, 2026).
REIT ETF yield, measured as trailing 12-month yield, was 3.50% (Nov 9) for VNQ, 3.08% (Sep 30, 2026) for SCHH, 2.51% (Sep 30, 2026) for IYR, 3.23% (Nov 9) for XLRE, 2.85% (Sep 30, 2026) for USRT and 3.29% (Nov 9) for FREL on the dates in the table above. The issuers also publish a 30-day SEC yield: 2.83% (Oct 31, 2026) for VNQ, 3.40% (Nov 6, 2026) for SCHH, 3.05% (Sep 30, 2026) for IYR, 3.27% (Nov 6, 2026) for XLRE, 3.20% (Sep 30, 2026) for USRT and 3.35% (Sep 30, 2026) for FREL. The two measures use different periods and different dates, so small gaps can come from timing alone.
See what is dividend yield and yield vs total return for how to read yield next to price change.
REIT ETF holdings and overlap
Matched stock by stock on tickerEvery comparison page matches the two funds’ full holdings by ticker. The overlap figure adds up the smaller of the two weights for every stock both funds hold.
These six funds overlap more than most categories, because every REIT index starts from the same pool of about 150 listed real estate companies. The range runs from 69% for XLRE and USRT to 94% for VNQ and FREL. SCHH shares 91% with FREL and 90% with VNQ. The lowest overlaps all involve XLRE, which holds only about 30 stocks.
| Comparison | Portfolio overlap |
|---|---|
| VNQ vs SCHH | 90% |
| VNQ vs IYR | 85% |
| VNQ vs XLRE | 74% |
| VNQ vs USRT | 80% |
| VNQ vs FREL | 94% |
| SCHH vs IYR | 88% |
| SCHH vs XLRE | 74% |
| SCHH vs USRT | 86% |
| SCHH vs FREL | 91% |
| IYR vs XLRE | 80% |
| IYR vs USRT | 78% |
| IYR vs FREL | 86% |
| XLRE vs USRT | 69% |
| XLRE vs FREL | 73% |
| USRT vs FREL | 82% |
Overlap is an estimate. Holdings dates differ: VNQ Sep 30, 2026; SCHH, XLRE and USRT Nov 6, 2026; IYR Nov 9, 2026; FREL Jul 31, 2026 (from its SEC filing). VNQ holds 14.6% of its assets in another Vanguard REIT fund, so its figures spread that position across the REITs inside it; matching only the stocks VNQ holds directly gives lower numbers, between 63% and 84% against the other five. Cash, futures and unmatched tickers are left out. Each comparison page also lists the ten largest holdings for both funds.
Use overlap before you add a second fund. Owning VNQ and SCHH repeats about 90% of the same weight, so a second REIT fund adds little. Test your own mix with the Diversification Calculator.
REIT ETF comparison, all fifteen pairs
Head to head, same formatEach page below puts two funds side by side on cost, yield, holdings overlap, sector mix, returns, payouts and the ten largest holdings. Every figure carries its date, and the data room at the bottom of each page lists the source and grade of each number. These REIT ETF comparisons are the quickest way to see what you own. Because the funds overlap so heavily, the differences that matter are cost, what the index includes and how concentrated the fund is.
VNQ vs SCHH
The largest REIT fund against the cheapest, with about 90% of their weight shared.
Read the comparisonVNQ vs IYR
Two broad real estate funds, one with mortgage REITs and a higher fee.
Read the comparisonVNQ vs XLRE
The whole sector against a 30-stock S&P 500 slice.
Read the comparisonVNQ vs USRT
MSCI real estate against equity REITs with no cell towers.
Read the comparisonVNQ vs FREL
Two MSCI real estate funds with the highest overlap of the group.
Read the comparisonSCHH vs IYR
Equity REITs only against a fund that adds mortgage REITs.
Read the comparisonSCHH vs XLRE
The lowest-cost fund against the compact large-company fund.
Read the comparisonSCHH vs USRT
Two equity REIT funds built on different indexes.
Read the comparisonSCHH vs FREL
Schwab’s equity REIT fund against Fidelity’s MSCI fund.
Read the comparisonIYR vs XLRE
Mortgage REITs and service companies against a 30-stock basket.
Read the comparisonIYR vs USRT
The broadest definition of real estate against the narrowest.
Read the comparisonIYR vs FREL
iShares’ broad fund against Fidelity’s lower-cost MSCI fund.
Read the comparisonXLRE vs USRT
The least overlap in the group, and the only pair without tower exposure on one side.
Read the comparisonXLRE vs FREL
A 30-stock fund against a 126-stock fund from Fidelity.
Read the comparisonUSRT vs FREL
Equity REITs without towers against the whole MSCI sector.
Read the comparisonHow to compare REIT ETFs
A seven-point checklist- 1. Index Check which index the fund follows and what it includes, such as mortgage REITs in IYR or the cell tower gap in USRT.
- 2. Breadth Holdings run from 30 to 139 here. A 30-stock fund concentrates more in the largest names.
- 3. Cost Expense ratios run from 0.07% to 0.37% here. Add the bid/ask spread when you trade.
- 4. Concentration Look at the ten largest holdings. They are 48.0% to 59.4% of each fund, larger than in broad stock funds.
- 5. Overlap Compare holdings. If most of the stocks repeat what you own, a second fund adds little.
- 6. Income Compare 12-month totals and yields, not a single quarter.
- 7. Dates and sources Do not rank funds on mismatched dates. Compare returns only when the periods match.
Start with how to research an ETF if the terms are new, and size any REIT fund inside your whole allocation with asset allocation explained.
REIT ETF fees and what you really pay
Cost beyond the expense ratioThe expense ratio is the annual fee that REIT ETFs take from the fund. On a $100,000 balance, 0.07% is $70 a year, 0.13% is $130 and 0.37% is $370. The gaps are small in any one year, but the fee comes straight out of return and compounds over decades. Use the ETF Fee Calculator to turn the fees into dollars over your own time horizon.
Trading costs come from the bid/ask spread, the gap between what buyers pay and sellers receive. Five of the six funds showed spreads of 0.01% to 0.04% in the dated figures, and the spread can widen when markets are stressed. Check the live spread, use limit orders for larger amounts and avoid the first and last minutes of the session.
Tax cost matters too. Most REIT distributions are taxed as ordinary income rather than as qualified dividends, and part may be treated as return of capital, so many investors hold REIT funds in tax-advantaged accounts. The treatment depends on the account, so see the Canada section below and confirm the details with a qualified tax professional.
Which REIT ETFs suit which investor
Matching the fund to the planYou want the whole real estate sector: VNQ or FREL, which follow MSCI real estate indexes. Compare them on the VNQ vs FREL page.
You want equity REITs at the lowest cost: SCHH, or USRT if you accept no cell towers. See SCHH vs USRT.
You want a compact fund of large companies: XLRE holds about 30 stocks. Read SCHH vs XLRE.
You want mortgage REITs included: IYR is the only fund here that holds them, at a higher fee. See VNQ vs IYR.
You already own a U.S. total market or S&P 500 fund: it already holds some real estate, so a REIT fund adds to a sector you own. Check what you own with the Diversification Calculator. Size any position against your whole portfolio and your time horizon.
Common mistakes with REIT ETFs
Easy ones to avoidOwning two REIT funds. VNQ plus SCHH repeats about 90% of the same weight. Two tickers can still be one holding.
Assuming all REIT funds match. IYR holds mortgage REITs, USRT holds no cell towers and XLRE holds about 30 stocks. The index, not the label, is what you own.
Judging VNQ by its top holding. About 14.6% of VNQ sits in another Vanguard fund that holds REITs, so its real top positions look different once that holding is counted through.
Comparing returns over different dates. Issuers report to different month-ends. Compare returns only when the dates match, as the tables on this site do.
Ignoring interest rates. REIT prices fell sharply in 2022 when rates rose, and the recovery since has been uneven.
Holding REITs in a taxable account without checking. Distributions are mostly ordinary income, so the account type matters.
Risks of REIT ETFs
What diversification does not removeHigher rates press prices
REITs borrow to buy property and compete with bonds for income investors. In 2022 the six funds lost between 24.4% and 26.2%.
Rents and vacancies move
Office, retail, apartments and warehouses do not move together. A fund holding a mix still falls when property values fall.
Distributions are not fixed
REITs pay out most of their taxable income, so the payout can fall when property income falls, and part of it can be return of capital.
Owning dozens or hundreds of REITs lowers the risk of any one company, but it does not remove sector risk. The funds can fall together and the recovery can take years. Past losses are not a limit on future ones.
REIT ETFs for Canadian investors
Currency, withholding tax and accountsU.S.-listed funds such as VNQ, SCHH, IYR, XLRE, USRT and FREL trade in U.S. dollars. Buying them from a Canadian account usually involves converting Canadian dollars, which adds a cost, and some brokers let you hold U.S. dollars to avoid repeated conversions. A move in the U.S. dollar also changes your return in Canadian dollars.
Distributions paid to Canadian holders are generally subject to U.S. withholding tax, and the treatment depends on the account type. The tax treaty exemption usually applies inside an RRSP, while a TFSA is not exempt, and a non-registered account is taxed differently again. Canadian-listed REIT funds can be taxed differently from U.S.-listed ones. This is general education, not tax advice.
Confirm the rules for your accounts with a qualified tax professional, and see how to build an ETF portfolio for how a REIT fund fits inside an allocation.
Tools for comparing REIT ETFs
Run your own numbersHow REIT ETFs are researched here
Sources and datesFigures come from the issuer pages and files for each fund: Vanguard for VNQ, iShares for IYR and USRT, Schwab for SCHH, State Street for XLRE and Fidelity for FREL, plus StockAnalysis for market data, payouts and the same-date returns.
Returns are market price total returns computed from daily adjusted closing prices to Nov 9, 2026, so all six funds share the same dates. Overlap sums the smaller weight of each stock by ticker and is an estimate, since the holdings dates differ. FREL’s full holdings come from its SEC filing, and VNQ’s holding of another Vanguard REIT fund is counted through to the REITs inside it. The pages are educational research, not personal advice, and they do not recommend a particular fund for your situation.
REIT ETFs, questions answered
Plain answersWhat are REIT ETFs?
REIT ETFs are exchange-traded funds that hold real estate investment trusts, companies that own income-producing property such as apartments, warehouses, data centers, cell towers and shopping centers. REITs must pay out most of their taxable income, so the funds tend to pay larger distributions than the average stock fund. The six compared here are VNQ, SCHH, IYR, XLRE, USRT and FREL.
What is the difference between VNQ and SCHH?
VNQ follows the MSCI US IMI Real Estate 25/50 Index and holds 139 stocks. SCHH follows the Dow Jones Equity All REIT Capped Index, holds 120 stocks and charges 0.07% against 0.13% for VNQ. The two share about 90% of their weight once VNQ’s holding of another Vanguard REIT fund is counted through to the REITs inside it. The VNQ vs SCHH comparison has the full breakdown.
Which REIT ETF has the lowest cost?
SCHH lists the lowest expense ratio of the six at 0.07%, followed by XLRE and USRT at 0.08% each, FREL at 0.084%, VNQ at 0.13% and IYR at 0.37%. On $100,000 that is $70 a year for SCHH against $370 for IYR. The ETF Fee Calculator turns the gap into dollars over your own time frame.
Why does IYR cost more than the other REIT ETFs?
IYR charges 0.37%, about five times SCHH, and it holds only 58 stocks. It also covers the broader real estate sector, so it includes mortgage REITs and real estate service companies that the pure property funds leave out. Its overlap with the other five ranges from 78% to 88%.
Why does USRT hold no cell tower REITs?
USRT follows the FTSE Nareit Equity REITs 40 Act Capped Index, which in the holdings file compared here contains no American Tower, Crown Castle or SBA Communications. The other five funds hold at least one of them, so USRT is the only fund in the group that misses the cell tower part of the sector.
Do REIT ETFs pay dividends?
Yes, all six pay quarterly. Trailing 12-month yields on the pages used here ranged from 2.51% for IYR to 3.50% for VNQ, and the dates differ by provider. REITs must distribute most of their taxable income, so the payout moves with property income and can change from quarter to quarter.
Are REIT ETFs risky?
REIT prices are sensitive to interest rates and to the property cycle. In the market price total returns computed here, the six funds lost between 24.4% and 26.2% in calendar 2022, and the five-year annualized returns ran only from 1.33% to 3.69%. Past results do not predict future ones.
Should I own more than one REIT ETF?
Usually not. The six funds overlap by 69% to 94% of their weight, so a second fund repeats most of the first. VNQ and FREL share about 94%. XLRE and USRT share the least at 69%, but both are still mostly the same large REITs.
Do I already own REITs in a total market fund?
Probably, in a small amount. A total U.S. stock market fund holds real estate companies as one of its sectors, so a REIT ETF adds to a sector you may already own. Check the overlap with the Diversification Calculator before adding a REIT fund on top.
Are REIT ETFs a good fit for Canadian investors?
U.S.-listed funds can work, but you face currency conversion and U.S. withholding tax on distributions, and the treatment depends on the account. The Canada section below covers the basics. Confirm the details for your accounts with a qualified tax professional.
Educational research, not personalized investment, tax or legal advice, and not a recommendation to buy or sell any fund. Investing involves risk, including loss of principal. Past performance does not guarantee future results. Fund data are provided as published by the sources named and may differ from current figures.