SCHD Explained: Dividends, Holdings and Risks
Understand what you own, evaluate the payments and give the fund a clear portfolio role.
Research checked October 3, 2026 · Examples are hypothetical and in USD
SCHD explained starts with a simple distinction: investing in dividend-paying companies is different from buying a guaranteed income stream. The Schwab U.S. Dividend Equity ETF offers a way to hold a selected group of U.S. dividend stocks through one exchange-traded fund.
For investors interested in cash distributions, that can be an appealing structure. Instead of researching and maintaining every company individually, they can use a fund with a defined investment approach. However, understanding that approach matters more than recognising the ticker.
A dividend ETF still owns stocks. Its investment value can fall, its distributions can change, and its results depend on the businesses it holds. Receiving cash does not automatically mean your overall investment is growing.
This guide examines seven practical facts about SCHD, including stock selection, expenses, dividend calculations, reinvestment and portfolio fit. The aim is to help you understand what you would own and how to evaluate it alongside your other investments.
Research checked October 3, 2026. Fund figures carry their own dates. Examples are hypothetical, in USD, and exclude taxes and trading costs unless stated.
1. SCHD Explained: Understand What You Own
SCHD is an index ETF whose objective is to track the total return of the Dow Jones U.S. Dividend 100 Index before fees and expenses. Buying its shares gives you exposure to a portfolio rather than a direct holding in one company.
Think about the difference through a household example. Someone who buys shares in one business depends heavily on that business. Someone who buys a fund spreads the investment across its holdings, although the fund can still have meaningful concentrations.
Suppose an imaginary portfolio holds 100 companies. If each receives an equal allocation, every company represents 1%. If the portfolio uses different weights, several companies could account for a much larger share of the invested money.
That is why counting holdings is only a starting point. You also need to examine their weights, industries and shared economic risks. A long holdings list does not mean that every business contributes equally.
A useful SCHD explained guide therefore begins with the underlying exposure. What types of businesses does the approach favour? How does that exposure compare with what you already own? Which parts of the market does it leave elsewhere in your portfolio?
Imagine that your existing investments already contain several dividend-paying companies. Adding a dividend ETF could broaden your holdings, repeat existing positions or do both. The answer requires looking beneath the fund name.
You do not need to memorise every holding before investing. You do need a clear description of the exposure you are adding. “A selected U.S. dividend-stock allocation” is a more useful description than “another income ticker.”
If you are still learning how these funds operate, start with our complete beginner’s guide to ETFs.
2. Stock Selection Looks Beyond the Highest Yield
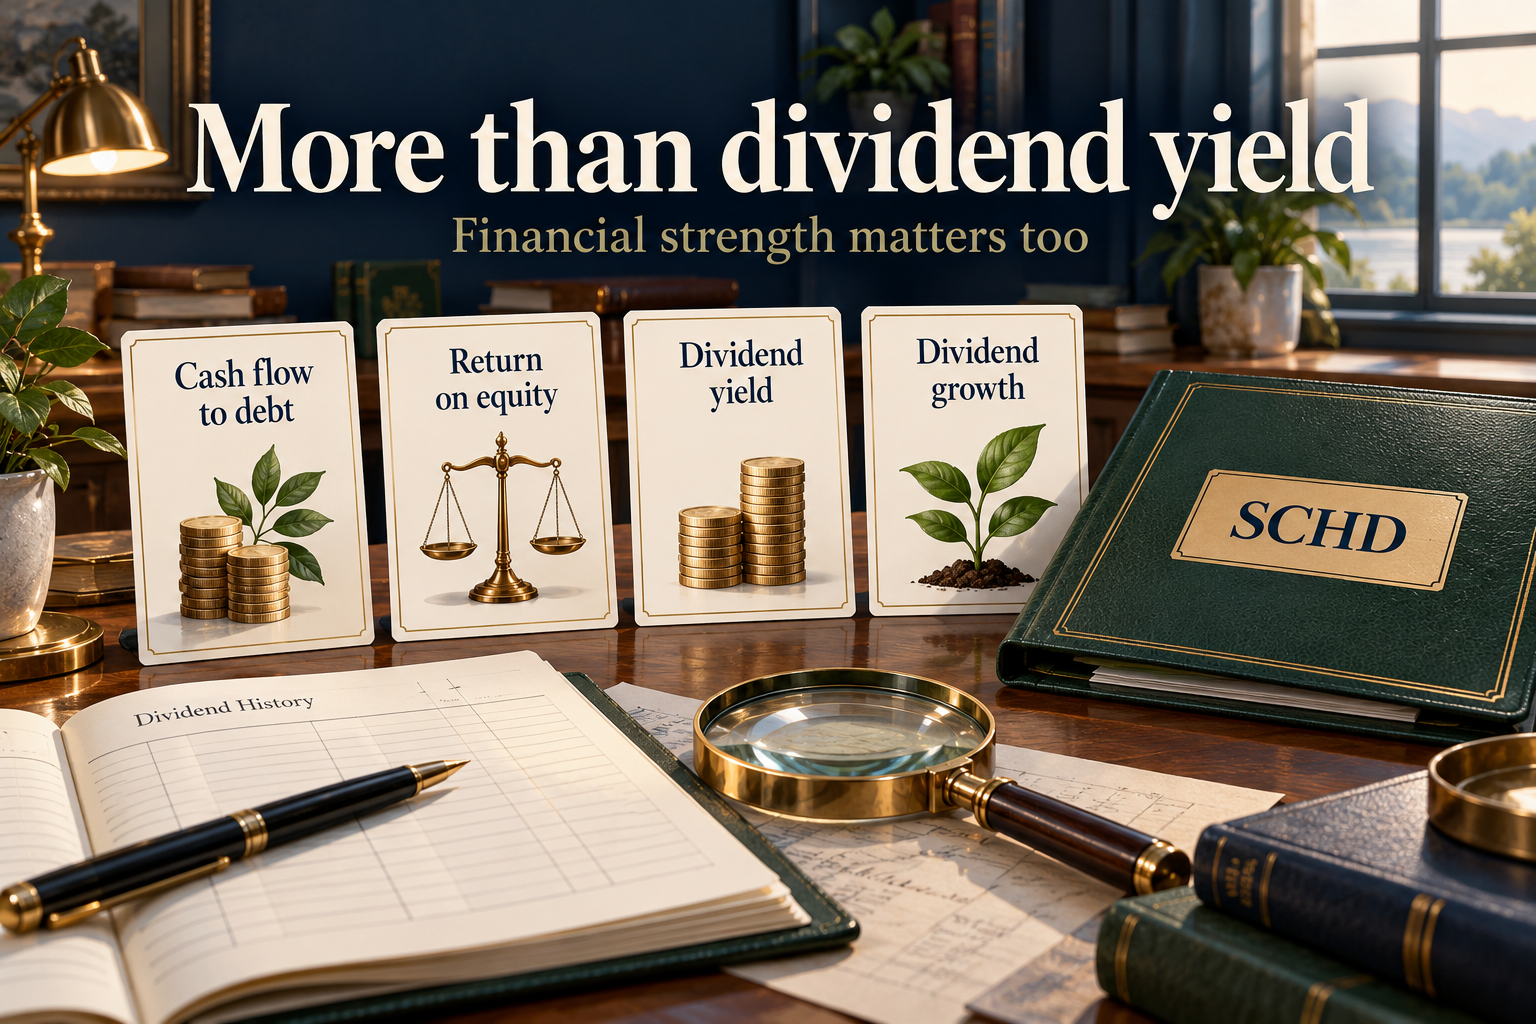
The benchmark requires at least ten consecutive years of dividend payments, alongside size and liquidity requirements. Its selection considers cash flow to total debt, return on equity, dividend yield and five-year dividend growth.
Ten years of payments should not be confused with ten years of uninterrupted increases. Paying a dividend and raising a dividend are different achievements.
The selection criteria also illustrate why a headline yield cannot tell the whole story. A company may offer a large cash payment while facing weakening profits, heavy debt or limited flexibility.
A hypothetical comparison between two businesses
Consider two invented companies. Company A has a share price of $50 and pays $2 annually per share. Its indicated dividend yield is 4%. Company B has a share price of $20 and pays $1.60 annually, producing an 8% yield.
Company B offers the larger percentage payment. However, suppose its cash generation is deteriorating while significant debt approaches maturity. Company A, meanwhile, has more stable cash generation and manageable obligations.
This does not prove that Company A is a better investment. Its valuation could still be expensive, and its business could encounter problems. It shows why income analysis needs more than the largest percentage.
The question becomes whether the company can support its payment while continuing to operate, invest and meet obligations. A payment that looks attractive today may become less attractive if the underlying business weakens.
Dividend growth needs context
Suppose an annual dividend rises from $1.00 to $1.10 per share. That is a 10% increase. If the next payment remains unchanged, the earlier increase does not create another automatic increase.
Investors sometimes turn an observed growth rate into a permanent assumption. A more careful approach separates what happened from what might happen next.
For SCHD research, use the current fund documents to understand the selection approach. Then evaluate whether that approach matches the exposure you want. Historical dividend growth can inform the discussion without becoming a promise.
3. SCHD’s Expense Ratio Is Small, but Total Costs Matter
SCHD lists an annual expense ratio of 0.06%. At a constant investment value, that corresponds to approximately $6 annually for every $10,000 invested.
| Investment value | Expense ratio | Approximate annual expenses |
|---|---|---|
| $10,000 | 0.06% | $6 |
| $50,000 | 0.06% | $30 |
| $100,000 | 0.06% | $60 |
These calculations explain the rate. They do not predict an exact account charge, because the amount invested changes with market movements and transactions.
Your purchase process can introduce other costs. Consider a hypothetical broker charging $5 for each purchase. Twelve purchases would cost $60 in commissions, separate from fund expenses.
For a $10,000 position, those assumed commissions are ten times the simple annual fund-expense estimate. That does not make regular investing a mistake. It makes the brokerage arrangement relevant.
Another investor might pay no purchase commission but incur a currency-conversion charge. A third might have different account fees. The same ETF can therefore involve different implementation costs for different investors.
Before establishing a purchase schedule, estimate the costs you can identify. Include commissions, conversion charges and account fees where applicable. Consider the bid-ask spread when placing orders.
In this SCHD explained comparison of costs, the practical question is what your complete investing process costs, rather than whether the fund’s expense ratio looks low in isolation.
4. Dividend Income Requires Careful Arithmetic
When estimating cash income, distinguish an actual declared distribution from an assumed yield. The first tells you a specified payment per eligible share. The second is an estimate based on a calculation and its assumptions.
Suppose an imaginary fund declares a distribution of $0.25 per share and you hold 200 eligible shares. Your gross payment would be 200 multiplied by $0.25, or $50.
If a later distribution is $0.22 per share, the same 200 shares generate $44. An unchanged share count does not ensure an unchanged payment.
These figures are teaching examples, not SCHD distribution amounts. Use Schwab’s distribution records and announcements when checking actual payments.
An annual yield is not a payment schedule
Imagine a $10,000 investment with an assumed annual cash-distribution rate of 3.5%. Multiplying $10,000 by 3.5% produces $350.
Dividing $350 by twelve gives approximately $29.17. That is a monthly budgeting equivalent. It does not mean the investment will deposit $29.17 every month.
Payment timing and payment amounts must be checked separately. Someone using investment income for regular bills needs to plan around the actual distribution calendar and possible variability.
A higher yield can result from a lower price
Suppose annual distributions total $1 per share. At a $25 share price, that amount represents 4%. At a $20 price, it represents 5%.
The percentage has increased even though the cash amount has not. An investor who already owned the shares would also have experienced a decline in their market value.
This is why a rising yield should prompt a question: did the payment increase, did the price fall, or did both change?
For a fuller explanation of the calculation, read what dividend yield means and how to calculate it.
5. Decide Whether to Spend or Reinvest Distributions

A distribution creates a practical decision. You can use the cash for spending, hold it temporarily or invest it again. The appropriate choice depends on the purpose of the account.
An investor funding current expenses may value available cash. Someone building assets for a distant goal may prefer to reinvest. Neither choice can be judged properly without knowing what the money is meant to accomplish.
A whole-share reinvestment example
Suppose an investor receives $120 and wants to purchase additional shares at a hypothetical price of $30. Before costs, the cash buys four shares.
At a hypothetical price of $32, the same $120 buys three whole shares for $96 and leaves $24. The remaining cash can be combined with future distributions or other permitted deposits.
If the broker supports fractional shares, the purchase may work differently. If it supports automatic reinvestment, the process may require less manual work. These features depend on the account and brokerage.
For someone limited to whole shares, a simple cash ledger can help. Record the distribution received, the purchase cost and the remaining balance. This makes it easier to distinguish cash waiting for investment from money already invested.
Reinvestment and return assumptions
Consider a mathematical illustration with $10,000 earning a constant 6% annual total return. If all returns remain invested, the balance after ten years would be approximately $17,908.
The calculation is $10,000 multiplied by 1.06 raised to the tenth power. It assumes no withdrawals, no additional contributions and a constant return.
This is not a SCHD forecast. Real annual returns fluctuate, and a 6% total return is not the same as a 6% dividend yield.
When reading a projection, ask whether dividends are already included in the assumed total return. Adding a distribution yield again would count the same income twice.
A useful SCHD explained reinvestment plan specifies what happens to cash while recognising that neither the future purchase price nor the future payment is fixed.
6. Measure Total Return Alongside Cash Income
Cash received and investment value need to be reviewed together. Otherwise, an income statement can look reassuring while the overall position has lost money.
Suppose you invest $10,000. Over a simplified one-year period, you receive $350 in cash distributions and finish with shares worth $9,000.
Your combined ending value is $9,350 if the cash remains unspent and earns nothing. That is a $650 loss, or negative 6.5%, before taxes and costs.
Now imagine a different outcome: the shares finish at $10,500 and you receive the same $350. The combined gain is $850, or 8.5%.
The cash amount is identical in both scenarios. The total result is very different.
| Measure | Scenario A | Scenario B |
|---|---|---|
| Starting investment | $10,000 | $10,000 |
| Ending share value | $9,000 | $10,500 |
| Cash distributions | $350 | $350 |
| Combined return | −6.5% | 8.5% |
Use matching comparison methods
If you compare two investments, use matching dates and clearly stated reinvestment assumptions. Comparing one fund’s price chart with another fund’s total-return chart can produce a misleading conclusion.
Your personal return may also differ from a published fund return. Purchases made throughout the year enter the market at different prices. Withdrawals, account costs and idle cash can further change the result.
Keep separate records for contributions, withdrawals, distributions and ending value. This helps you understand whether progress came from investment performance or from adding more money.
Our article on dividend yield versus total return explores this distinction in more detail.
7. Give SCHD a Clear Role in Your Portfolio
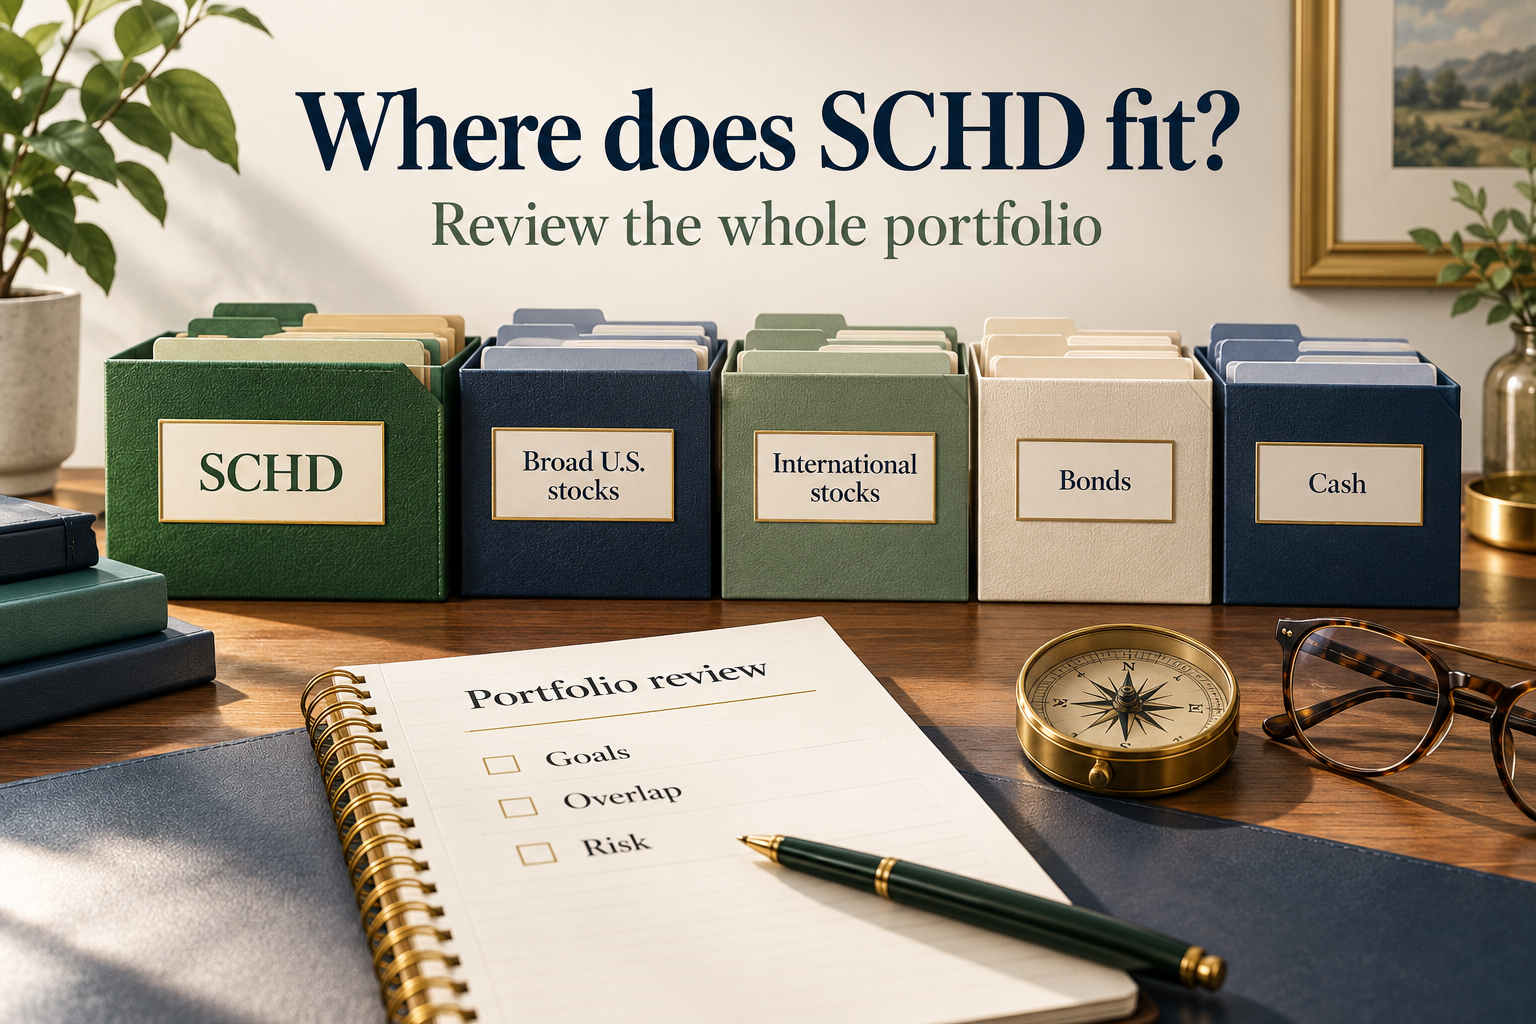
The final question is what SCHD would contribute to your overall plan. A fund can be understandable and inexpensive while still repeating exposure you already have in sufficient amounts.
For example, someone may use a dividend-stock allocation to support a preference for cash distributions. Another person may want to adjust the characteristics of an existing stock portfolio. Those are different purposes and deserve different evaluations.
Calculate overlap rather than counting tickers
Imagine a $20,000 broad-market fund and a $10,000 dividend fund. In a hypothetical example, one company represents 2% of the first fund and 4% of the second.
The broad-market position supplies $400 of exposure to that company. The dividend position supplies another $400. Together, the company represents $800 of the $30,000 portfolio, or approximately 2.67%.
If you own another $2,000 of the company directly, the combined exposure becomes $2,800 out of $32,000, or 8.75%.
The additional direct position changes the picture substantially. Looking only at fund names would miss that concentration.
Match the investment to the timing of the goal
Suppose one investor is saving for a purchase next year and another is building assets for a goal twenty years away. Their ability to tolerate a decline is unlikely to be identical.
Before deciding on a dividend-stock allocation, consider what would happen if the investment fell when you needed the money. Would you postpone the goal, use other reserves or have to sell?
This question connects investment risk to an actual consequence. It is more useful than describing yourself as comfortable with volatility without considering the timing of your spending.
For a wider framework, read how to build an ETF portfolio.
A Practical Review Before Buying
Write a short explanation of why you are considering the fund. Include the exposure you want, the amount you intend to invest and what you plan to do with distributions.
Then test that explanation against a difficult scenario. Suppose the market value declines while cash payments arrive below your original estimate. Would the holding still serve its intended purpose?
- Purpose: Explain the role of a dividend-stock allocation.
- Exposure: Review holdings and sector weights alongside your existing investments.
- Costs: Include fund expenses and relevant account-level charges.
- Income: Separate declared payments from yield estimates.
- Cash use: Decide whether distributions will be spent, retained or reinvested.
- Risk: Consider how a decline would affect the timing of your goal.
- Review: Establish what would justify changing the holding.
A plan does not need to be complicated to be useful. It needs to describe decisions you can follow consistently and review when your circumstances change.
Frequently Asked Questions
What does SCHD stand for?
SCHD is the ticker symbol for the Schwab U.S. Dividend Equity ETF. The ticker identifies the fund for trading and research.
Does SCHD guarantee dividend income?
No. An estimate based on previous distributions does not guarantee future payments. Use actual distribution announcements when checking a specific payment.
How much does SCHD cost annually?
Its listed expense ratio is 0.06%. A constant $10,000 investment corresponds to approximately $6 in annual fund expenses, separate from relevant brokerage and account costs.
Can I reinvest SCHD distributions?
You can use available cash to purchase more shares, subject to your brokerage and account rules. Automatic reinvestment and fractional-share availability vary, so confirm the features of your account.
Is a higher dividend yield always better?
No. A yield can rise because the share price falls. Evaluate the payment, the underlying investment and the change in your total wealth together.
Can SCHD be held with a broad-market ETF?
Yes, but assess the combined exposure. Adding a dividend fund can change portfolio weights while also repeating companies already held through another fund.
Does owning more shares improve my percentage return?
No. Share count alone does not establish investment performance. Evaluate the amount invested, the percentage change in value and cash received.
Before You Decide
SCHD explained properly is a discussion about ownership, income and portfolio design. The useful question is whether its approach supports the purpose of your money at a cost and risk level you understand.
Review the current documents, compare the exposure with your existing holdings and write down how you will handle distributions. That gives you a clearer basis for a decision than relying on a yield figure alone.
Check income and capital together
Change the assumptions to see how the cash received and ending share value combine. These are independent teaching inputs, not a forecast of SCHD.
Cash = starting value × cash assumption. Ending shares = starting value × (1 + price change). Combined return = cash assumption + price change. Cash remains unspent and earns nothing; no reinvestment, contributions or withdrawals. Price change includes the effect of distributions on value. Do not add cash again to an assumed total return or subtract expenses again from an already-net return.