Market Correction vs Bear Market: Understanding the Difference
Compare the thresholds, financial pressures and recovery challenges—and see why a market label cannot tell you what happens next.
For the broader overview, start with our complete market-correction guide. This market correction vs bear market guide compares classifications, the pressures that can deepen losses, and the different planning consequences.
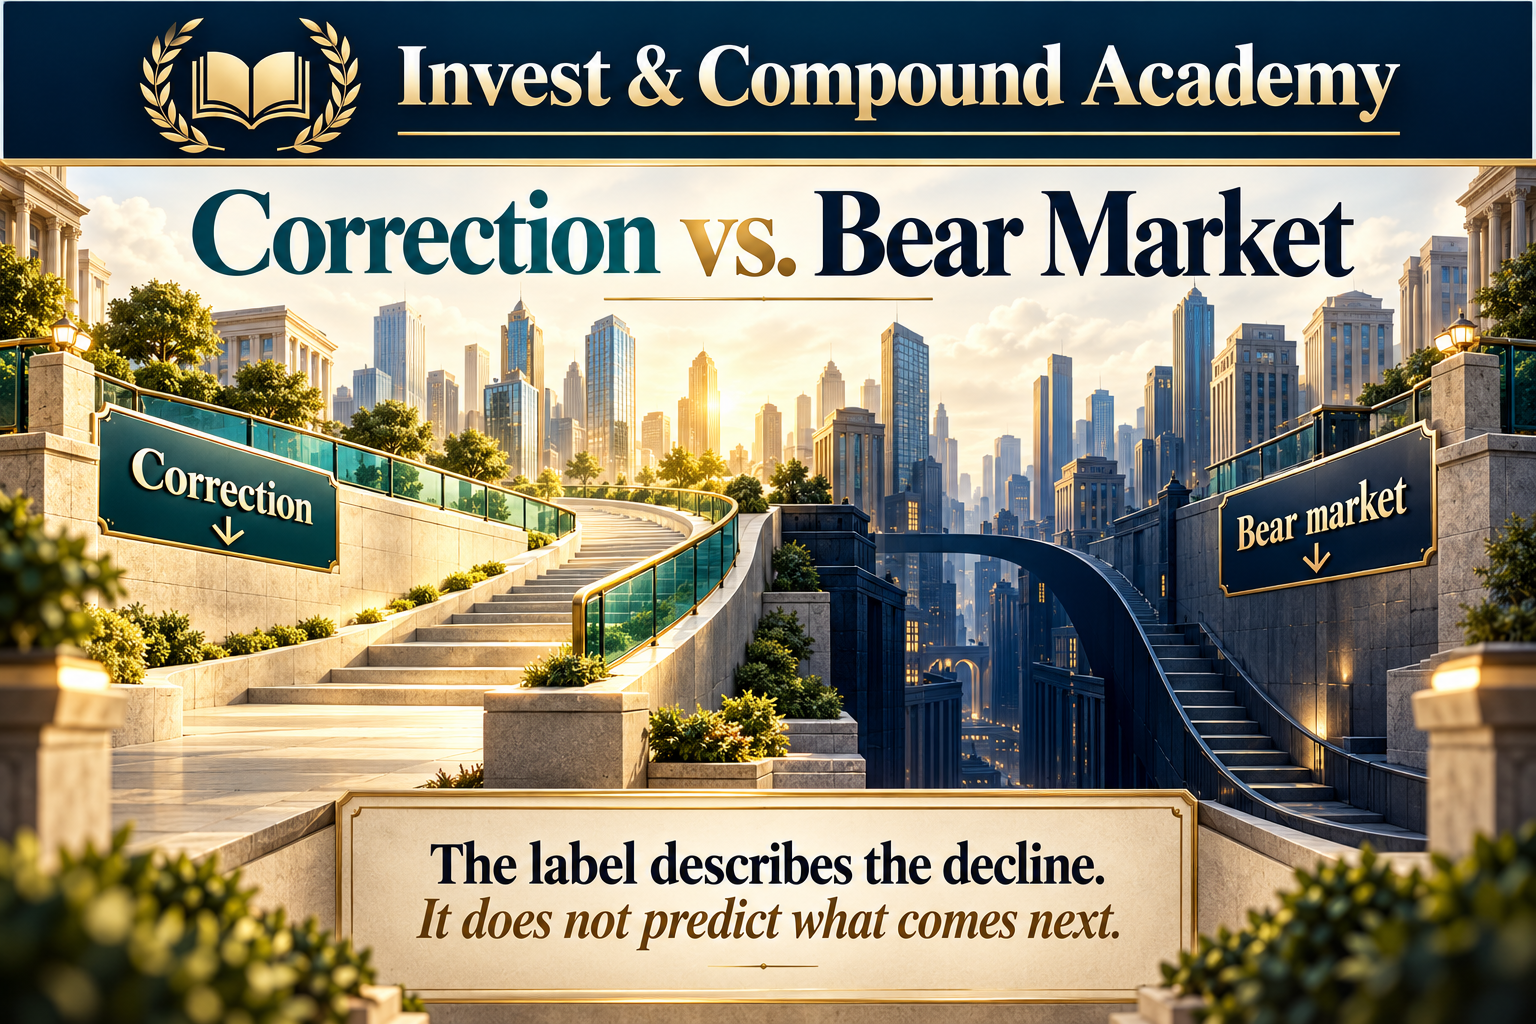
A stock market decline of 10% can feel unsettling. A decline of 20% can feel like an entirely different financial environment. Headlines become more alarming, portfolio losses become harder to ignore, and investors begin questioning assumptions that seemed reasonable only months earlier. Financial professionals use two familiar terms to describe these experiences: market correction and bear market. The distinction appears straightforward. A market correction generally refers to a decline of at least 10% but less than 20% from a recent market peak. A bear market is conventionally recognized when prices fall at least 20% from that peak.
Yet the difference between these conditions extends beyond a numerical threshold. A correction can emerge from changing interest-rate expectations, temporary uncertainty, stretched valuations, or disappointing economic information. A bear market may involve some of the same forces, but deeper declines can place greater pressure on household finances, corporate balance sheets, credit availability, and investor confidence. Neither label guarantees a particular economic outcome. A 12% correction can occur without a recession, while a bear market can develop during a period of economic expansion. Some bear markets unfold rapidly; others involve prolonged declines interrupted by substantial rallies.
The practical challenge is that investors do not know the ultimate depth of a market downturn while it is unfolding. A market that has fallen 12% might recover within weeks. It might decline another 5%. It might eventually fall 35% or more. At the moment of the initial decline, all these outcomes remain possible. For long-term investors, understanding the distinction between a correction and a bear market is therefore less about predicting the next headline and more about recognizing how market losses affect portfolio construction, liquidity, financial objectives, and the mathematics of recovery.
This guide compares the two market conditions, examines the mechanisms behind them, explains why historical averages require careful interpretation, and develops a practical framework for making investment decisions during falling markets.
What Is the Difference Between a Market Correction and a Bear Market?
The primary difference is the magnitude of the decline from a previous market high. A market correction occurs when an index or other asset falls at least 10% from its recent peak. When analysts classify completed drawdown episodes, they generally distinguish corrections that remain below 20% from bear markets that reach or exceed 20%. A bear market occurs when the decline reaches at least 20%. These thresholds are widely recognized financial-market conventions rather than universal legal definitions.
Financial researchers may differ in how they identify a market peak, which index they analyze, whether they use closing or intraday prices, and when they consider a downturn to have ended. The numbers are useful, but the underlying measurement must remain consistent.
Market Correction vs Bear Market at a Glance
| Characteristic | Market correction | Bear market |
|---|---|---|
| Conventional decline | 10% to less than 20% | 20% or more |
| Measurement | From a previous market peak | From a previous market peak |
| Historical frequency | More frequent | Less frequent |
| Typical historical duration | Generally shorter | Generally longer |
| Economic recession required? | No | No |
| Possible causes | Valuation shifts, rates, earnings, uncertainty | Similar forces, sometimes with deeper financial or economic stress |
| Portfolio implications | Meaningful drawdowns and changing risk exposure | Larger capital losses and potentially greater liquidity pressure |
| Recovery | May be relatively quick or prolonged | May be relatively quick or prolonged |
| Guaranteed outcome | None | None |
The table describes historical tendencies, not rules governing individual episodes. A correction can last longer than a particular bear market. A bear market can recover rapidly while a less severe decline takes much longer to regain its previous high. Similarly, a bear market does not establish that the economy has entered a recession. The classification tells investors how far prices have fallen. It does not independently explain why they have fallen or where they are going next.
How the 10% and 20% Thresholds Work
Imagine that the S&P 500 reaches an illustrative peak of 6,000 index points. Subsequently, the market begins declining. At 5,700, the index is down 5%. At 5,400, it is down 10%. At 5,100, it is down 15%. At 4,800, the index is down 20%. The calculation is based on the same initial peak.
If the index falls from 6,000 to 4,800, the calculation becomes:
The decline has crossed the conventional bear-market boundary. An important detail is that percentage declines should not be added mechanically. For example, if an investment loses 10% and then loses another 10% of its reduced value, the total decline is not 20%. Beginning with $100: After the first decline, the investment is worth $90. After the second decline, it is worth $81. The cumulative loss is 19%. This distinction is particularly relevant when investors read headlines stating that a market has fallen another 5% or 10%. The reference level matters.
Does a Market Immediately Become a Bear Market at 20%?
Under a strict threshold-based definition, a decline reaching 20% qualifies. However, commentators and index providers may use different conventions. Some researchers classify bear markets only after a closing-price decline reaches the threshold. Others discuss intraday crossings. Certain historical datasets also impose rules concerning how rebounds, new highs, and overlapping drawdowns are classified. As a result, a market may briefly trade more than 20% below a previous high during the trading day but close above the threshold. One analyst may describe the index as having entered bear-market territory intraday. Another may reserve the formal classification until the closing index level qualifies.
Both statements can be understandable when the methodology is disclosed. For investment analysis, consistency is more important than choosing whichever definition creates the most dramatic headline.
Why the Difference Matters to Investors
Investors might reasonably ask why the distinction deserves attention. After all, the market does not fundamentally change because an index moves from a 19.9% decline to a 20.1% decline. The answer lies in the way these classifications help organize investment risk. A correction represents a significant but comparatively moderate decline relative to historical bear-market episodes. A bear market identifies a deeper loss of market value that may create greater pressure on leveraged investors, companies seeking financing, retirement portfolios, and financial institutions. However, the classification is descriptive rather than causal.
Crossing 20% does not automatically cause corporate earnings to decline, banks to restrict lending, or unemployment to rise. Those developments depend on underlying economic and financial conditions. The bear-market label can nevertheless influence investor perceptions and behavior. Financial commentary may become more pessimistic. Investors may reassess their willingness to accept losses. Portfolio managers may review risk limits or rebalance exposures. The larger losses themselves can also affect financial decisions independently of the label. Someone with $200,000 invested in an equity portfolio would see its value decline to $180,000 after a 10% loss.
A 20% loss would reduce the portfolio to $160,000. The additional $20,000 decline could materially affect a planned property purchase, retirement date, or withdrawal schedule. For this reason, the distinction is useful in portfolio planning, even though it cannot reliably predict what happens next.
Do Market Corrections Always Become Bear Markets?
No. Many corrections stabilize and recover without reaching the 20% threshold. A correction can occur because valuations became temporarily demanding, interest-rate expectations changed, or investors reacted to an economic uncertainty that subsequently diminished. If corporate earnings remain resilient and financial conditions stabilize, investors may gradually become more willing to purchase equities. Prices can recover without a full economic contraction. However, there is no reliable signal that identifies which corrections will remain moderate. Consider two hypothetical markets. Market A falls 12% after investors become concerned about an unexpected inflation report.
Subsequent inflation data improve, earnings remain resilient, and the index begins recovering. Market B also falls 12% after an inflation surprise. However, financing costs continue rising, consumer demand weakens, earnings forecasts deteriorate, and credit conditions tighten. Market B subsequently declines 30%. At the original 12% drawdown, the numerical classification was identical. The difference emerged from the evolution of economic conditions and expectations. This demonstrates why evaluating a correction requires more than monitoring percentage thresholds. Investors need to consider whether the underlying investment case has changed and whether their portfolio can tolerate adverse outcomes beyond those already observed.
Can a Bear Market Occur Without a Recession?
Yes. A bear market and an economic recession describe different phenomena. A bear market is defined primarily through market prices. A recession involves a significant deterioration in economic activity, generally assessed through multiple indicators such as employment, production, income, and spending. Stock prices are forward-looking. Economic measurements generally describe conditions that have already developed. Because the two operate on different timelines, bear markets can occur without recessions, and stock markets may begin recovering before economic conditions improve.
The 1987 Stock Market Crash
The 1987 stock market crash provides an important example. On October 19, 1987, the Dow Jones Industrial Average experienced an extraordinary single-day decline. The broader U.S. equity market suffered a severe downturn that crossed conventional bear-market thresholds. However, the United States did not enter an economic recession in 1987. This event illustrates how market structure, liquidity, investor behavior, and rapid changes in expectations can create enormous price movements without an accompanying recession. It also demonstrates why the speed of a decline must be analyzed separately from the underlying business cycle.
Why Investors Confuse the Two
Financial markets and economic activity influence each other. Declining stock prices can weaken household confidence and reduce the ability of companies to raise equity capital. More restrictive financial conditions may discourage investment and spending. At the same time, deteriorating economic activity can reduce corporate profits and put downward pressure on stock prices. This creates a feedback relationship. But the relationship is not automatic. Market prices sometimes fall because investors anticipate a recession that never occurs. They may also recover because investors anticipate improving conditions well before official economic indicators confirm an expansion.
Consequently, the claim that a bear market necessarily means a recession is economically inaccurate.

Historical references: Federal Reserve History on the 1987 crash and the NBER business-cycle chronology.
Why Market Corrections Happen
Market corrections can develop for many reasons. Understanding their common causes helps explain why some declines stabilize while others intensify.
Valuation Reassessment
A long period of rising stock prices can produce elevated valuation multiples. Investors may become willing to pay increasingly high prices for future earnings. If growth expectations become less optimistic, those valuations can contract. Consider a company expected to earn $10 per share. At a price-to-earnings ratio of 25, its implied share price is $250. If investors reduce the appropriate valuation multiple to 22, the implied price becomes $220. That represents a 12% decline even though expected earnings remain unchanged. This type of repricing can occur without a fundamental collapse in the business.
It reflects a change in what investors are prepared to pay.
Interest-Rate Expectations
Higher interest rates increase the required return on many financial assets. When discount rates rise, the present value of future corporate cash flows generally declines. Growth-oriented investments can be particularly sensitive when a substantial portion of their estimated value depends on profits expected far into the future. However, the effect depends on the business. Companies with substantial debt may also face increasing financing costs. Financial institutions can experience both benefits and challenges depending on lending margins, funding costs, credit quality, and the shape of the yield curve. Therefore, interest-rate-driven corrections do not affect every industry equally.
Disappointing Earnings
A company can report profits and still disappoint investors. The relevant comparison is frequently between actual results and expectations already reflected in the share price. If analysts anticipate exceptional earnings growth, merely strong results may prove insufficient. A broad decline in forward earnings expectations can affect an entire index. When weaker earnings forecasts combine with declining valuation multiples, market losses can become considerably larger.
Geopolitical and Policy Uncertainty
Changes in trade policy, military conflicts, political developments, and regulatory decisions can alter financial expectations. These events may influence commodity prices, supply chains, investment spending, and business confidence. However, investors should not assume that every geopolitical shock produces a prolonged bear market. The market response depends on the severity, duration, and economic consequences of the disruption.
For how an earnings multiple translates into a price, see P/E ratio explained. The multiple and the earnings estimate can change independently.

Why Bear Markets Can Become More Severe
A deeper bear market may involve mechanisms that extend beyond an initial valuation reassessment. The same factors that produce a correction can intensify and interact.
Deteriorating Corporate Earnings
If economic demand weakens substantially, businesses may experience falling revenue, shrinking margins, and reduced profitability. Companies that previously appeared reasonably valued can become more expensive relative to lower expected earnings. Consider a business initially earning $8 per share and trading at 20 times earnings. Its share price is $160. Suppose expected earnings decline to $6 while the market reduces its valuation multiple to 16. The implied price becomes $96. That represents a 40% decline. The damage results from the combination of lower earnings and lower willingness to pay for each dollar of earnings.
This simultaneous adjustment can contribute to severe bear-market losses.
Credit Stress
Companies often depend on borrowing to finance operations, investment, and refinancing obligations. When lenders become more cautious, credit may become harder to obtain or more expensive. Financial institutions may tighten underwriting standards. Corporate bond investors may demand larger credit spreads. Borrowers approaching debt maturities can face additional pressure. These developments can affect investment, employment, and consumer confidence. A downturn involving substantial credit deterioration can become more difficult to resolve than one driven primarily by temporary changes in market sentiment.
Liquidity Constraints
Liquidity describes the ability to buy or sell an asset without materially affecting its price. During periods of stress, buyers may become less willing to provide capital at prevailing prices. Market participants needing immediate cash may accept lower prices to complete transactions. This can amplify declines. In leveraged portfolios, falling collateral values may trigger margin calls and forced selling. Consequently, some investors become sellers not because they believe an asset has poor long-term prospects, but because they lack the liquidity to maintain the position.
Negative Feedback Loops
Financial conditions can reinforce economic weakness. Lower asset prices may reduce confidence and investment spending. Weaker economic activity may lower earnings. Lower earnings may increase concerns about debt repayment. Credit becomes more expensive, further reducing economic activity. These feedback mechanisms are not present to the same degree in every bear market. They help explain why the severity of market declines cannot be predicted solely from the initial catalyst.
A falling quotation needs a business-level explanation. Our guide to reading a stock’s financial numbers connects profitability, valuation and debt.
Market Correction vs Bear Market: Historical Frequency
Market corrections have historically occurred more frequently than bear markets. That is unsurprising because the 10% threshold is easier to reach than the 20% threshold. However, historical frequency statistics require careful interpretation. Fidelity’s April 2026 research reports that the S&P 500 has historically spent more than one-third of the time since 1927 trading at least 10% below a previous high. This does not mean a new correction begins every third year or that the market must decline on a fixed schedule. Time spent below a peak is different from the number of separate correction episodes.
Similarly, Fidelity’s September 2026 research describes U.S. bear markets as occurring roughly every six years on average over a long historical observation period. That average does not imply a dependable six-year market cycle. Some bear markets occur relatively close together. Others are separated by lengthy periods of rising prices.
Why Market History Depends on the Dataset
Suppose one researcher studies daily S&P 500 closing prices beginning in 1950. Another studies a longer historical reconstruction of U.S. equity prices. A third examines monthly total returns. Their results may differ because they are not measuring exactly the same series. Similarly, a researcher who counts every independent 10% drawdown may report a different correction frequency from someone who combines closely spaced declines into a single episode. Historical statistics should therefore be accompanied by clear information about the index, observation dates, return type, frequency of observations, and drawdown classification. Without these details, apparently precise averages can become misleading.
Sources: Fidelity’s correction overview and bear-market overview. Their different statistics describe different datasets and measures, not a market timetable.
How Long Do Corrections and Bear Markets Last?
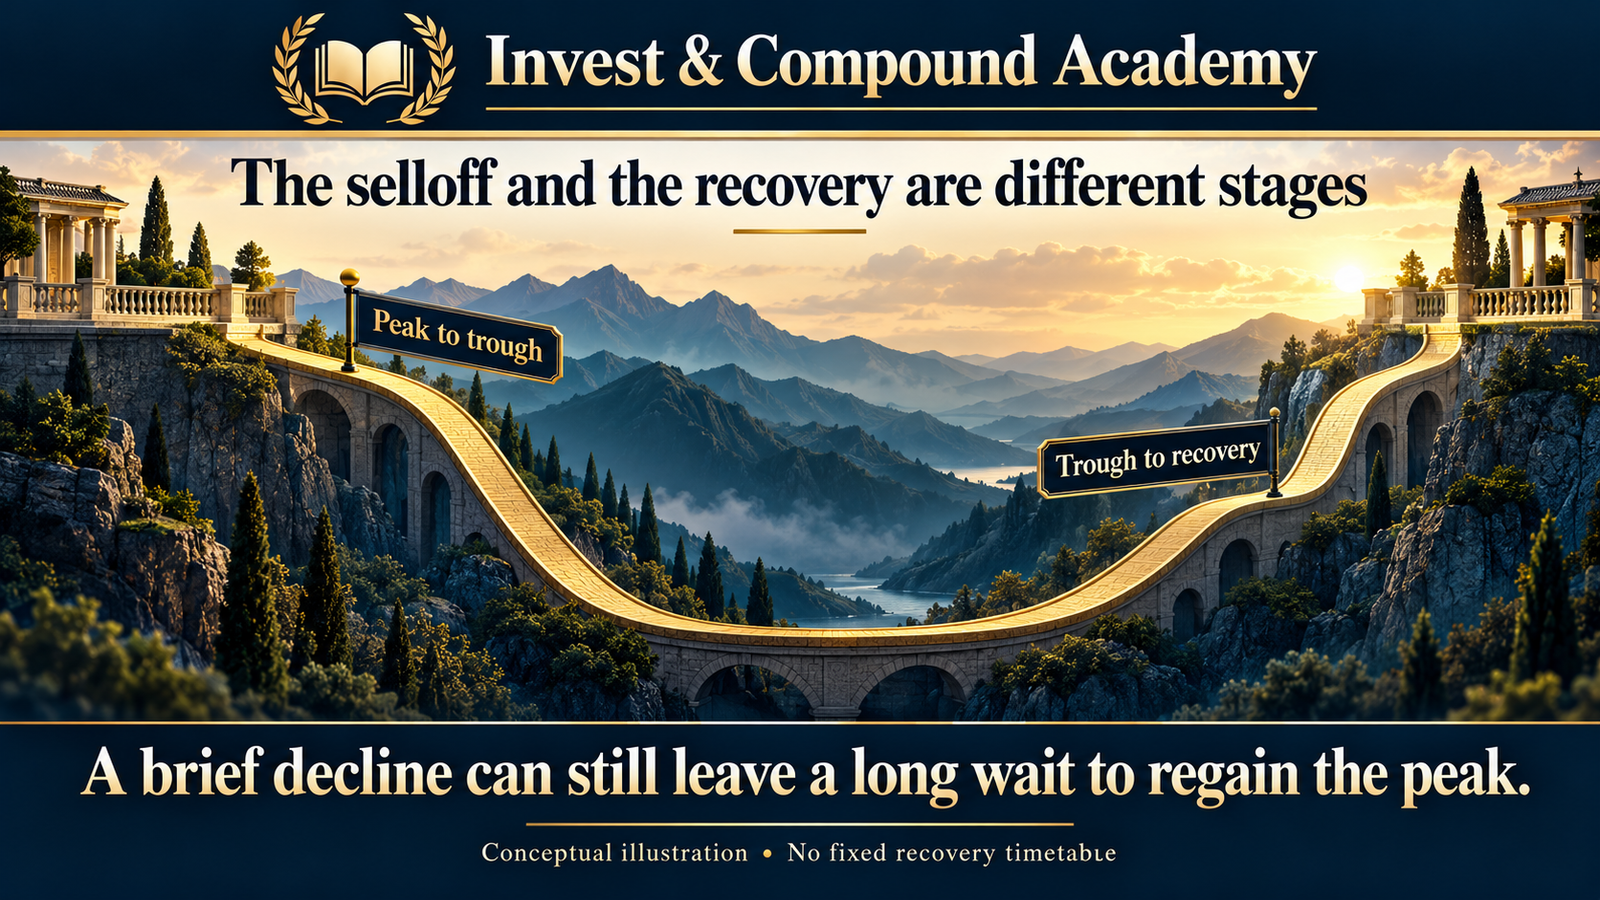
Bear markets have historically tended to last longer than corrections. However, duration can be measured in several different ways. The peak-to-trough period measures the time between the market’s previous high and its subsequent lowest point. The recovery period measures the additional time required to regain that peak. The peak-to-recovery period combines both stages. These measures describe different investor experiences. Suppose an index reaches 100 on January 1, declines to 85 on March 1, and regains 100 on November 1. The peak-to-trough period is approximately two months. The peak-to-recovery period is approximately ten months.
An investor who held the index throughout the decline experienced a relatively short selloff but a much longer interval before recovering the previous peak.
Comparing Two Hypothetical Declines
| Measurement | Correction A | Bear Market B |
|---|---|---|
| Initial peak | 100 | 100 |
| Lowest value | 85 | 65 |
| Maximum decline | 15% | 35% |
| Time to trough | 45 days | 180 days |
| Time from trough to recovery | 120 days | 480 days |
| Total peak-to-recovery time | 165 days | 660 days |
These are hypothetical figures intended to illustrate the methodology, not historical market averages. Notice that the bear market creates two challenges. First, the capital loss is much larger. Second, the example requires investors to endure a longer period before the index returns to its previous level. Yet neither relationship is guaranteed. An abrupt bear market can recover more quickly than a prolonged correction. Market recovery depends on changes in expectations, economic conditions, valuations, policy, and investor behavior.

Historical Market Examples
Historical evidence shows that market downturns differ substantially in severity and duration. The following episodes provide context without suggesting that future declines will follow the same pattern.
The 2018 Market Correction
In early 2018, rising concerns about inflation and interest rates contributed to a sharp decline in U.S. stocks. After reaching a high in late January, the S&P 500 experienced a decline exceeding 10% before stabilizing. Later that year, the market experienced another pronounced selloff amid concerns about monetary policy, trade tensions, and the outlook for growth. These episodes illustrate how financial conditions and investor expectations can produce significant equity declines without necessarily requiring a recession. They also demonstrate that more than one material selloff can occur within a calendar year.
The 2020 Pandemic Bear Market
The early 2020 market collapse was exceptionally rapid. The COVID-19 pandemic introduced substantial uncertainty about economic activity, supply chains, employment, and corporate earnings. Equity prices fell sharply as investors reassessed the financial impact of restrictions and economic disruption. The S&P 500 entered bear-market territory within weeks. The subsequent recovery was influenced by extraordinary monetary and fiscal measures, changing expectations, and the ability of businesses and consumers to adapt. The episode illustrates that a bear market does not necessarily require a prolonged period of declining prices.
A rapid collapse and a relatively swift recovery can occur within the same broader market episode. However, the speed of that recovery should not be assumed to represent a normal or repeatable outcome.
The 2007–2009 Global Financial Crisis
The global financial crisis provides a very different example. Financial-market losses emerged alongside severe deterioration in housing-related credit, bank balance sheets, and financial-system confidence. As credit conditions weakened, businesses and households faced a much more challenging economic environment. The S&P 500 experienced a peak-to-trough decline of approximately 57% on a closing-price basis. This was not simply a moderate correction caused by temporary discomfort over valuation levels. The downturn involved deep financial instability and a major economic recession. Its severity highlights the importance of credit conditions, leverage, and liquidity when evaluating market risk.
The 2000–2002 Technology Collapse
The bursting of the technology bubble demonstrated the consequences of elevated valuations and excessive expectations. Many technology and telecommunications companies had been priced for extraordinary future growth. As expectations changed, valuations collapsed. The broader S&P 500 experienced a severe bear market, while technology-heavy indexes suffered even larger losses. The episode illustrates a crucial point. A company or industry can possess genuine long-term economic potential while still representing a poor investment at an excessively high purchase price. A transformative technology does not guarantee that every company associated with it will generate satisfactory shareholder returns.
Lessons From Different Market Environments
These downturns were not interchangeable. The 2018 episodes were associated with changing financial conditions and economic expectations. The 2020 collapse reflected an extraordinary public-health and economic shock. The 2007–2009 crisis involved systemic financial instability. The technology downturn involved significant valuation excesses and subsequent disappointment. Investors should be cautious about interpreting every correction as the beginning of another 2008 or assuming that every bear market will recover as quickly as the 2020 episode. Historical comparisons are valuable when used to understand mechanisms and possible outcomes. They become less useful when treated as predictions.
The benchmark itself also matters. See how the S&P 500 works for the role of its constituents and weighting.
The financial-crisis decline is documented in Federal Reserve History’s Great Recession review. Historical price declines exclude dividends unless specified.
The Mathematics of Market Losses and Recoveries
One of the most important differences between a correction and a bear market is the proportional gain required to recover the original portfolio value. Losses and gains are not symmetrical. Consider an investor starting with $100,000. After a 10% correction, the portfolio is worth $90,000. To return to $100,000, the portfolio must increase by approximately 11.11%. Now consider a 20% bear-market decline. The portfolio falls to $80,000. Returning to $100,000 requires a 25% gain. A 40% decline would reduce the portfolio to $60,000. Recovering from that level would require approximately 66.67%.
Recovery Requirements
| Market decline | Value of $100,000 portfolio | Gain needed to recover |
|---|---|---|
| 10% | $90,000 | 11.11% |
| 15% | $85,000 | 17.65% |
| 20% | $80,000 | 25.00% |
| 25% | $75,000 | 33.33% |
| 30% | $70,000 | 42.86% |
| 40% | $60,000 | 66.67% |
| 50% | $50,000 | 100.00% |
The required recovery is calculated as:
This relationship explains why larger drawdowns can have a disproportionate effect on long-term investment results. The difficulty increases further if an investor withdraws money while the portfolio is depressed.
Sequence-of-Returns Risk During Bear Markets
Sequence-of-returns risk is particularly important for investors approaching retirement or already making withdrawals. The sequence in which positive and negative returns occur can materially affect portfolio sustainability. Consider two investors beginning retirement with identical portfolios and planned withdrawals. Investor A experiences strong returns early in retirement, followed by negative returns. Investor B experiences significant losses immediately after retirement, followed by stronger returns later. Even if both portfolios have similar average investment returns over the observation period, their outcomes may differ because withdrawals interact with changing portfolio values.
For Investor B, early withdrawals can require selling a larger proportion of the remaining assets. That reduces the number of shares available to participate in a later recovery.
A Simplified Retirement Example
Assume a retiree begins with $500,000 and withdraws $25,000 at the beginning of the year. After the withdrawal, $475,000 remains invested. If the invested balance experiences a 25% decline, its value falls to $356,250. If another $25,000 is withdrawn before a recovery occurs, the remaining balance declines to $331,250. This example ignores fees, taxes, distributions, and subsequent investment returns. It illustrates why market losses can be especially consequential when investors must continuously remove capital. For retirees, risk management is not solely about the average return over several decades.
Liquidity, withdrawal flexibility, investment allocation, and the timing of losses all influence financial outcomes.
How Corrections and Bear Markets Affect ETFs
An ETF does not provide automatic protection against broad market declines. Its performance depends on the underlying assets, weighting methodology, investment strategy, and other structural characteristics.
Broad-Market Equity ETFs
An ETF designed to track the S&P 500 generally experiences movements closely related to that index. Fund expenses, tracking differences, distributions, and trading conditions can create differences between the index and realized investor returns. If the S&P 500 experiences a correction or bear market, a fully invested index-tracking ETF ordinarily participates in much of that decline. Diversification across hundreds of companies reduces individual-company concentration but does not eliminate systematic equity-market risk.
Growth-Oriented ETFs
Growth-oriented indexes may be more sensitive to changes in valuation multiples and discount rates. A technology-heavy ETF can experience deeper declines than a broad-market index when investors reduce the prices they are willing to pay for long-term earnings growth. However, that relationship is not guaranteed in every market downturn. Business profitability, sector composition, valuations, and the specific economic catalyst all matter.
Dividend ETFs
Dividend-oriented ETFs may contain established companies generating regular cash distributions. Some may emphasize profitability, balance-sheet quality, or dividend consistency. However, dividend payments do not prevent share prices from falling. A dividend ETF can experience a severe decline if underlying businesses face deteriorating earnings, funding pressure, or broader market repricing. Dividend policies can also change. Investors should distinguish between receiving cash distributions and preserving portfolio capital.
Covered-Call and Income ETFs
Covered-call strategies may collect option premiums that provide partial downside offsets under some conditions. However, option income is not guaranteed, and these strategies can still experience substantial capital losses. The premiums received do not create a fixed protective floor. Some structures also surrender part of the potential upside when markets rebound strongly. Consequently, investors should evaluate total return, distribution sustainability, option strategy mechanics, fees, and underlying exposure rather than relying exclusively on an ETF’s quoted distribution rate.
Bond ETFs
Bond ETFs may behave differently from equity ETFs, but their risks depend on duration, credit quality, and the economic environment. High-quality government bonds may provide diversification during some equity-market downturns. However, rising interest rates can cause bond prices to decline. Corporate bonds can also suffer losses when investors demand larger compensation for credit risk. The fact that two ETFs belong to different asset classes does not guarantee that their returns will move in opposite directions.
Compare VOO vs QQQ for different index exposures, and dividend yield vs total return for why distributions alone do not measure the investor’s result.
Investor Behavior During Corrections and Bear Markets
Market declines can create substantial psychological pressure. A correction may initially appear manageable because the investor has experienced similar volatility before. As losses deepen, anxiety may increase. News coverage often becomes more alarming, and financial forecasts may become increasingly pessimistic.
Loss Aversion
Investors often experience losses more intensely than equivalent gains. This can lead to decisions intended primarily to eliminate immediate emotional discomfort. Selling after a decline may provide temporary relief, but it also converts an unrealized loss into a realized transaction outcome and removes exposure to any subsequent recovery. That does not mean selling is always wrong. It means the decision should be based on a financial rationale rather than the emotional intensity of recent price movements.
Recency Bias
During a prolonged bull market, investors may begin expecting strong returns to continue. During a bear market, they may become convinced that losses will continue indefinitely. Both beliefs overemphasize recent experience. A disciplined investor evaluates changing fundamentals without assuming that the latest market trend will persist forever.
Herd Behavior
Investors may interpret widespread selling as evidence that others possess important information. However, market participants have different objectives. Some are reducing leverage, others are rebalancing, and others need immediate cash. Observing their transactions does not reveal the full reasoning behind them.
Emotional Fatigue
Prolonged bear markets can be psychologically more difficult than brief corrections. An investor may tolerate a sudden 12% decline but struggle with months of volatility, repeated failed rallies, and uncertainty about the future. Emotional endurance therefore forms part of practical risk tolerance. A portfolio that appears acceptable in a spreadsheet may become unsuitable if its fluctuations routinely cause the investor to abandon the strategy.
Should Investors Respond Differently to a Correction and a Bear Market?
The correct response depends more on the investor’s circumstances than on the label attached to the market. A 20% decline does not automatically justify selling. A 10% correction does not automatically justify purchasing more shares. Investment decisions should consider financial goals, liquidity, portfolio allocation, and whether the underlying investment assumptions remain valid.
Reassess the Investment Thesis
Investors holding individual companies should examine whether expected earnings, competitive positioning, financial obligations, or management performance have materially changed. A market-wide repricing may create a different investment question from a company-specific deterioration. For diversified ETF investors, relevant considerations include index composition, sector concentration, valuation exposure, fees, and the fund’s continued suitability.
Review Liquidity
An investor with adequate emergency reserves may have greater flexibility during a downturn than someone who needs to sell investments to cover living expenses. Liquidity can influence whether the investor can maintain a strategy through market volatility.
Evaluate Concentration
A portfolio with substantial exposure to one stock or industry may experience greater losses than the broad market. A market decline can reveal concentration risks that were less obvious during rising markets.
Review Leverage
Leverage magnifies gains and losses. A leveraged investor may be forced to reduce exposure at unfavorable prices if collateral requirements are breached. Bear markets can therefore be especially damaging when borrowing creates the possibility of forced liquidation.
Maintain a Written Investment Process
A documented investment plan can reduce the influence of short-term emotions. That plan may establish a target allocation, contribution policy, liquidity reserve, rebalancing approach, and circumstances that justify reviewing the strategy. The purpose is not to prevent all portfolio adjustments. It is to ensure that changes reflect deliberate decisions rather than temporary market panic.
Our ETF research guide provides a framework for reviewing a fund’s holdings, strategy and implementation.
Buying During a Correction vs. Buying During a Bear Market
Lower market prices can improve prospective investment returns when expected future cash flows remain unchanged. However, investors should distinguish between price declines and genuine undervaluation. Suppose an ETF initially trades at $100. After a 12% correction, its price falls to $88. An investor contributing $1,000 can purchase approximately 11.36 shares, assuming fractional shares are available. If the ETF declines further to $75, the same contribution could purchase approximately 13.33 shares. A lower price increases the number of shares obtained for a fixed investment.
However, the investor buying at $88 would experience an additional unrealized decline of approximately 14.77% if the price subsequently fell to $75. The opportunity to purchase more shares does not eliminate market risk.
Lump-Sum Investing
Lump-sum investing involves deploying available investment capital at one time. This approach provides immediate market exposure. It can perform well when markets subsequently rise, but it also exposes the full amount to an immediate downturn.
Dollar-Cost Averaging
Dollar-cost averaging involves investing fixed amounts over a series of intervals. When prices decline, equal contributions purchase more shares. When prices rise, they purchase fewer shares. This creates a systematic purchasing process. However, dollar-cost averaging does not guarantee a profit or prevent losses. It may also underperform immediate investment when asset prices generally rise during the deployment period. The distinction between regularly investing new income and gradually investing an already available lump sum is important. These are related but not identical financial decisions.
Why Neither Approach Can Guarantee the Best Entry Point
A rebound does not prove that the final low is behind the market. The lowest point of a completed downturn can be identified only retrospectively, and the answer depends on how the episode is defined. Investors attempting to purchase at the exact bottom face significant uncertainty. An approach that depends on precise forecasting can therefore fail even when the investor correctly anticipates that markets will eventually recover.
Why Trying to Predict the Bottom Is Difficult
Financial markets respond to expectations about future conditions. By the time economic data confirm a deterioration, investors may already have incorporated much of the information into prices. Conversely, prices may begin recovering while current economic conditions remain weak. For example, suppose a market has declined because investors expect corporate earnings to fall 20%. If new information suggests earnings will decline only 10%, prices may rebound even though profits are still expected to decrease. Markets react not only to whether conditions are good or bad, but also to whether they are better or worse than anticipated.
This helps explain why rebounds can occur alongside disappointing economic news. It also explains why an apparently attractive valuation does not guarantee an immediate recovery. Investors may continue demanding higher risk premiums, or underlying earnings expectations may deteriorate further.
Portfolio Rebalancing Through Market Downturns
Rebalancing involves adjusting portfolio holdings to maintain an intended asset allocation. Suppose an investor begins with $100,000 allocated 60% to equities and 40% to bonds. The portfolio contains $60,000 in stocks and $40,000 in bonds. Assume stocks decline 25% while bond values remain unchanged. The equity allocation falls to $45,000. The total portfolio is now worth $85,000. Equities represent approximately 52.94% of the portfolio. Restoring a 60% equity target would require an equity position worth $51,000. The investor would therefore need to transfer $6,000 from bonds to equities, ignoring trading costs and taxes.
This approach provides an allocation-based reason to purchase equities after a substantial decline. However, rebalancing is not automatically profitable. Equity prices could continue falling after the rebalance. The primary purpose is to keep the portfolio aligned with the investor’s intended risk profile. A suitable rebalancing approach should account for taxes, transaction costs, investment accounts, and the frequency of portfolio reviews.
When fractional shares are unavailable, ETF rebalancing with whole shares explains funded trades and rounding.
How Market Downturns Affect Different Life Stages
The same bear market can create different financial consequences for investors at different stages of life.
Early-Career Investors
An investor with several decades until retirement may have time to recover from market declines. If employment income remains stable, the investor may continue accumulating assets through scheduled contributions. However, a long time horizon does not make concentrated or speculative investments automatically safe. Permanent company-specific losses remain possible.
Mid-Career Investors
Mid-career investors may need to balance retirement accumulation with mortgages, education costs, business obligations, and other financial commitments. A market correction may become problematic when household liquidity is insufficient or investment risk is poorly aligned with upcoming expenses.
Investors Approaching Retirement
A bear market shortly before retirement can create a meaningful planning challenge. Portfolio values may decline at the same time that future contributions are becoming smaller or ending. Investors may need to reassess withdrawal expectations, retirement timing, and the portion of their assets dedicated to near-term spending.
Retirees
Retirees face an additional challenge because they may withdraw capital during market declines. The resulting sequence-of-returns risk can make recovery more difficult. Retirement planning should therefore evaluate income needs, liquidity, withdrawal flexibility, and the risk characteristics of the entire portfolio.
Connect your goals and spending timeline to the role of each holding with our ETF portfolio construction guide.
Can Diversification Protect Against a Bear Market?
Diversification can help reduce concentration risk, but it cannot eliminate systematic market risk. A portfolio holding hundreds of stocks may still experience a substantial decline when broad equity markets fall. The effectiveness of diversification depends on the assets being combined. Two ETFs holding many of the same large companies may provide less diversification than their different fund names suggest. Investors should examine underlying holdings, sector exposure, geographic allocation, and return correlations. Combining stocks with bonds and cash-equivalent investments may help manage certain risks. However, correlations are not stable. During some periods, equities and bonds can decline together.
Similarly, international equities may provide geographic diversification while remaining sensitive to global financial conditions. Diversification should therefore be understood as a method of distributing risk, not a promise of capital preservation.
The VOO and VTI overlap workbook shows how shared holdings can leave a portfolio more concentrated than the number of funds suggests.
Can Market Indicators Predict a Bear Market?
Investors monitor many indicators in an attempt to assess the likelihood of larger declines. These may include corporate earnings revisions, credit spreads, valuation ratios, yield-curve developments, market breadth, volatility, and economic activity. Each can provide useful context. None reliably predicts every bear market.
Corporate Earnings Expectations
Declining earnings forecasts may indicate that businesses face weaker demand or rising costs. However, markets can decline before analysts reduce their estimates. Earnings expectations may also stabilize after share prices have already recovered.
Credit Spreads
Credit spreads reflect the additional yield investors demand for holding riskier debt relative to a reference security. Widening spreads can indicate rising concern about corporate credit quality or liquidity. But spreads also respond to changing market conditions and do not provide a precise forecast of equity prices.
Market Breadth
Market breadth describes the extent to which individual securities participate in market advances or declines. Weak participation may suggest that gains are concentrated in a smaller group of companies. However, narrow leadership can persist for extended periods without an immediate broad-market breakdown.
Valuation Measures
Elevated valuations can be associated with lower prospective long-term returns under some conditions. But valuation levels alone are poor short-term timing instruments. Markets can remain expensive or inexpensive longer than investors expect.
Volatility Measures
Measures of implied volatility reflect expectations embedded in options prices and related market dynamics. Elevated volatility can indicate uncertainty and greater demand for protection. However, volatility is not a direct forecast that stocks must continue falling. The same indicator may rise sharply near a market low or remain elevated through further declines. The most useful application of market indicators is often risk assessment rather than attempts to forecast precise turning points.
Market Correction vs Bear Market: Common Investor Mistakes
Assuming Every Correction Will Become a Crisis
Historical market corrections have occurred under many economic conditions. A decline does not automatically signal financial-system failure. Treating every correction as a major crisis can encourage unnecessary portfolio turnover.
Assuming Every Bear Market Will Recover Quickly
Some historical bear markets recovered rapidly. Others required years to regain previous peaks. Individual investments may never recover. A strategy based on the expectation of a quick rebound can expose investors to serious liquidity problems.
Confusing Market Prices With Investment Value
Lower prices may create opportunities, but they can also reflect deteriorating fundamentals. Investors should assess expected cash flows, balance-sheet risk, and valuation rather than relying solely on a percentage decline.
Ignoring Portfolio Concentration
Owning several ETFs does not necessarily produce meaningful diversification when their underlying holdings overlap significantly. A market downturn may expose risks that were previously hidden by strong returns.
Using Excessive Leverage
Borrowing to invest increases potential gains and potential losses. Margin calls and financing costs can undermine the ability to maintain an otherwise viable investment strategy.
Abandoning a Long-Term Plan Without Financial Justification
A strategy may need adjustment because an investor’s circumstances have changed. However, repeatedly changing allocations in response to market headlines can undermine discipline. Investment decisions should reflect objectives, risk capacity, and evidence rather than fear alone.
Frequently Asked Questions
Is a 15% Market Decline a Correction or Bear Market?
A 15% decline from a recent peak is conventionally classified as a market correction. The standard bear-market threshold is 20%. However, a 15% decline could eventually become part of a larger bear market if prices continue falling.
Is a 20% Decline Automatically a Bear Market?
Under the conventional threshold, yes. Researchers may differ in whether they require the index to close at least 20% below its previous high or accept intraday prices.
Do All Bear Markets Begin as Corrections?
Numerically, a decline reaching 20% crosses the 10% threshold; a price gap can skip intermediate traded levels. However, a sufficiently rapid crash can cross both boundaries during a single trading session.
Are Corrections More Common Than Bear Markets?
Yes. Historical equity-market data show that 10% declines have occurred more frequently than 20% declines. The precise frequency depends on the index, observation period, and methodology.
Is a Bear Market Worse Than a Recession?
They cannot be compared as though they measure the same thing. A bear market describes a decline in asset prices. A recession describes a deterioration in economic activity. Either may occur without the other.
Can a Market Recover Before a Recession Ends?
Yes. Investors frequently adjust prices according to expected future conditions. A market can recover before current economic data show substantial improvement.
Is It Safe to Buy Stocks After a 20% Decline?
A 20% decline does not guarantee that stocks are undervalued or that losses are over. The decision depends on valuation, financial objectives, liquidity, portfolio risk, and the underlying investment.
Do Dividend ETFs Perform Better in Bear Markets?
Not necessarily. Performance depends on sector composition, financial quality, valuation, investment methodology, and the causes of the downturn. Cash distributions do not prevent capital losses.
Should Investors Move Everything to Cash During a Bear Market?
There is no universal answer. A complete move to cash reduces immediate equity exposure but introduces reinvestment timing, inflation, and opportunity-cost risks. The appropriate allocation depends on an investor’s circumstances.
How Can Investors Prepare for Future Declines?
They can evaluate their asset allocation, diversify appropriately, maintain liquidity for near-term obligations, avoid unsuitable leverage, understand their holdings, and establish a disciplined investment process. Preparation does not require predicting exactly when the next decline will occur.
Final Thoughts: Market Labels Matter Less Than Portfolio Resilience
The central difference between a market correction and a bear market is numerical. A correction generally describes a decline of at least 10% but less than 20% from a previous peak. A bear market identifies a deeper decline of 20% or more. These categories become useful when placed within a broader framework of financial risk. A moderate correction can expose poor diversification, excessive leverage, or inadequate liquidity. A bear market can intensify those vulnerabilities while testing an investor’s ability to remain committed to a long-term strategy.
Historical evidence shows that market downturns differ greatly in their causes, depth, duration, and recovery patterns. No fixed threshold can determine whether a decline will continue, when it will end, or whether every investment will regain its previous value. For investors, the more productive approach is to evaluate what they own, why they own it, how much risk they can sustain, and when their capital may be needed. A long-term strategy should not depend on uninterrupted market growth.
It should recognize that significant declines are possible and ensure that financial obligations, portfolio construction, and behavioral discipline are compatible with that reality. Successful investing does not require predicting every correction or identifying every bear-market bottom. It requires understanding the risks involved, evaluating opportunities carefully, and developing a financial plan robust enough to withstand uncertainty. The distinction between a correction and a bear market is an important starting point.
The deeper lesson is that the quality of an investment strategy is measured not only by its returns during favorable markets, but also by its ability to remain financially viable during difficult ones.
Continue Learning
Connect this comparison to the broader market-risk guide and practical portfolio research.
Market risk, indexes and portfolio strategy
Market Correction Pillar | Indexes and Markets | Portfolio Construction
Sources and Further Reading
Editorial reference review: October 17, 2026. Historical figures retain their source observation periods and are not live market statistics. Unless identified as historical, numerical examples are hypothetical.
- Fidelity: What Is a Stock Market Correction?
- Fidelity: What Bear Markets Mean for You and Your Money
- Federal Reserve History: Stock Market Crash of 1987
- Federal Reserve History: The Great Recession
- NBER: U.S. Business Cycle Expansions and Contractions
- SEC Investor.gov: Asset Allocation and Diversification
This article provides general financial education, not personalized investment, tax or legal advice, a security recommendation, or a prediction of future performance.
Investments involve risk, including permanent loss of principal. Historical results do not guarantee future outcomes. Calculators simplify financial relationships and exclude the costs and cash flows specified beside each tool. Consider your goals, liquidity and circumstances, and consult qualified professionals where appropriate.