P/E Ratio Explained: How to Tell if a Stock Is Overvalued or Undervalued
A stock trading at 15 times earnings might be expensive. Another at 35 times earnings might be reasonably priced. The missing piece is what those earnings can become—and how much risk investors assume while waiting.
P/E ratio explained: the price-to-earnings ratio compares what investors pay for a share with the earnings attributable to that share. It is a useful starting point for valuation, but it cannot establish whether a stock is cheap or expensive on its own.
Suppose two friends are discussing stocks over coffee. One points to a company with a price-to-earnings ratio of 12 and says, “That one is cheap.” The other prefers a growing software business trading at 40 times earnings. Neither friend is necessarily wrong—but neither has made a complete investment case. A P/E ratio tells us what investors pay for earnings; it does not reveal whether those earnings are durable, whether the company can grow, or whether the price already assumes an exceptionally bright future.
That distinction matters because a stock purchase is not simply a purchase of last year’s profit. It is a claim on the uncertain stream of profits and cash flows a business may generate in years to come. Understanding the price-to-earnings ratio means learning to separate an apparently low price from genuine value—and an apparently high price from unwarranted optimism.
In this guide, we will calculate P/E ratios, compare historical and forecast earnings, study actual January 2026 industry-level data compiled by NYU Stern professor Aswath Damodaran, examine the PEG ratio, explore situations where P/E becomes unreliable, and use two interactive tools to test valuations yourself. The data is a historical research snapshot, not a live October 2026 price feed.
1. P/E Ratio Explained: What Does Price-to-Earnings Mean?
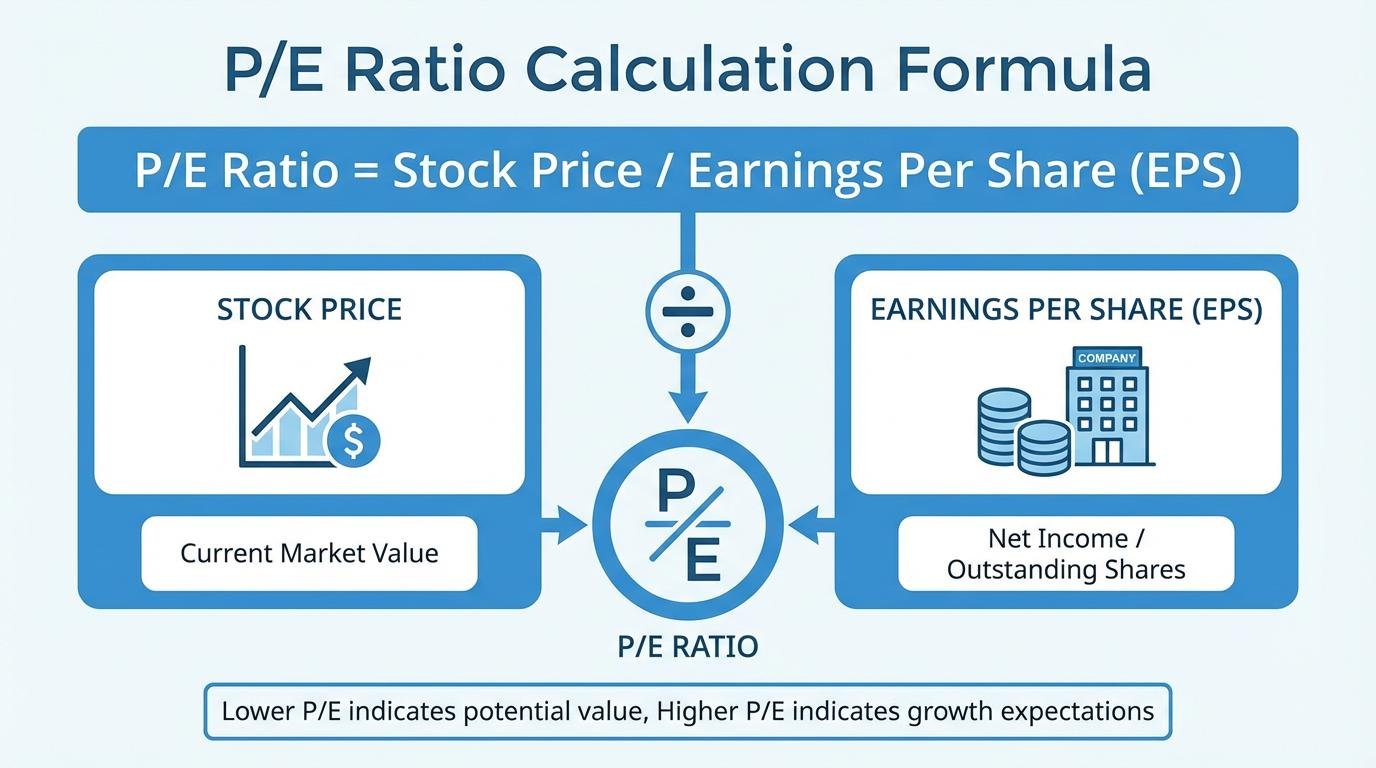
The price-to-earnings ratio, abbreviated P/E, measures the market price of one share divided by the company’s earnings per share (EPS). EPS generally refers to net income attributable to common shareholders divided by an appropriate share count; published basic and diluted EPS can differ. For valuation comparisons, analysts commonly prefer diluted EPS because it accounts for potential share issuance from instruments such as options and convertible securities.
Imagine a fictional business called Harbor Systems. Its shares trade at $120, and its earnings per diluted share over the last twelve months equal $6. Its trailing P/E is 20×. That means an investor pays $20 of market price for every $1 of the last twelve months’ earnings per share.
The result is a valuation multiple, not a promised interest rate. Investors sometimes say that a P/E of 20 means it takes twenty years to “earn back” the investment. That shortcut ignores dividends, reinvestment, growth, changing profits, financing decisions, and the possibility of loss. It is more accurate to think of P/E as a starting point for investigating future earnings.

Another useful measure is the earnings yield, which is the inverse of P/E. A 20× multiple corresponds to a 5% earnings yield: $6 divided by $120. This is an accounting earnings yield, not a cash distribution or guaranteed investment return. The company may retain its earnings, reinvest them at attractive or poor rates, or face cash conversion problems that reduce the economic benefit to shareholders.
2. P/E Ratio Explained: Trailing vs. Forward Earnings
The most common valuation disagreement is not about the share price. It is about the denominator. A trailing P/E uses earnings generated during an already completed period, usually the previous twelve months. A forward P/E uses expected earnings, often analysts’ projections for the next twelve months or a designated fiscal year. The phrase “forward P/E” can refer to different forecast windows across data providers, so always check the methodology before combining sources.
Return to Harbor Systems. Its share price remains $120, and the last twelve months generated EPS of $6, producing a trailing P/E of 20×. Analysts expect next-year EPS of $8. If their projection is accurate, the same $120 price implies a forward P/E of 15×. That lower forward multiple is not proof that the stock became cheaper overnight; it is a mathematical consequence of higher estimated future earnings.
| Metric | Trailing | Forward |
|---|---|---|
| Share price | $120 | $120 |
| EPS assumption | $6 realized | $8 forecast |
| P/E | 20× | 15× |
| Main weakness | Backward-looking; earnings may be abnormal | Forecast risk; assumptions may disappoint |
Neither is universally better. Trailing earnings are observable but may reflect unusual taxes, gains, write-downs, or a temporary boom. Forward earnings incorporate expectations about the future, but those expectations may be excessively optimistic precisely when investors feel most confident. When analyzing a company, examine both alongside normalized earnings over a full business cycle.
Consider a manufacturer at the top of an unusually profitable year. A seemingly modest trailing P/E of 9× can conceal the fact that profitability may fall sharply when demand normalizes. Meanwhile, a fast-growing enterprise can look expensive on last year’s earnings but much more reasonable if its forecasts prove achievable. The essential question is not “Which P/E is smaller?” but “How defensible is the earnings figure underneath the multiple?”
3. What real U.S. industry valuations reveal
To move beyond hypothetical examples, we examined Aswath Damodaran’s P/E Ratios by Sector (U.S.), dated January 2026. The dataset tracks 5,994 companies in its total-market grouping and reports current, trailing, and forward P/E metrics, along with the proportion of money-losing firms and selected earnings-growth measures. These are industry-level aggregates, and they should not be mistaken for the median company within each sector.
The most revealing feature is the dispersion between industries. The dataset shows a forward P/E of 64.81× for internet software, 37.29× for semiconductors, and 34.13× for system and application software. At the other end of our selected sample, money-center banks stand at 13.04×, air transport at 11.37×, and regional banks at 11.00×. These observations reflect the source’s published methodology and its January 2026 snapshot—not a current ranking of investable opportunities.
Source: Aswath Damodaran, NYU Stern, January 2026. Selected industry aggregates; bars scaled to the largest listed value.
Download the full U.S. industry valuation dataset
Go beyond the selected industries in our chart. Explore the complete January 2026 U.S. industry table, including company counts, loss-making businesses, current and trailing P/E, forward P/E, earnings-growth assumptions, and PEG ratios. The spreadsheet is supplied by NYU Stern and is best used as a dated research reference, not a live price feed.
Those differences do not automatically imply that software is overpriced or that regional banks are bargains. Investors often pay a higher multiple for companies expected to generate rapid, resilient earnings growth with attractive margins and relatively low capital needs. Banks, airlines, commodity producers, and other cyclical businesses can trade at lower multiples because earnings respond differently to interest rates, credit losses, capital requirements, economic demand, and financing costs.
Even within the same industry, two companies can merit very different multiples. A business with low debt, recurring revenue, strong customer retention, and sustained returns on invested capital may be fundamentally less risky than a superficially similar company with unstable profitability and refinancing problems. Sector averages are therefore context, not appraisal certificates.
The dataset also reveals why averaging valuations is tricky. In its total-market grouping, 57.16% of firms had trailing losses. Negative earnings make ordinary positive P/E comparisons invalid, and filtering loss-making firms can bias a sample toward survivors or more profitable businesses. The published data offers several aggregate treatments precisely because a single simple “average P/E” cannot fully describe a heterogeneous market. Investors should read the column definition before comparing any two values.


4. P/E Ratio Explained: Why High and Low Multiples Can Mislead
Valuation multiples are condensed statements about future expectations. A company with a high P/E must often sustain attractive growth and profitability for many years to justify its price. The danger is not necessarily that the company is bad. It is that the market may already be pricing an extraordinarily favorable outcome. Good businesses can make poor investments when purchased at unrealistic prices.
Conversely, a low-P/E stock may be genuinely undervalued, but the discount could signal deteriorating competitive position, substantial leverage, fading customer demand, regulatory pressure, weak cash conversion, or cyclically inflated current earnings. Investors call this a value trap: something that appears inexpensive relative to an earnings figure that proves unsustainable.
The four questions behind a valuation premium
- Growth: How quickly can sales, earnings, and free cash flow grow without requiring uneconomic investment?
- Quality: Are reported profits supported by operating cash flow? Are margins stable and returns on capital attractive?
- Risk: How sensitive is the company to debt, interest rates, customer concentration, regulation, and cyclical demand?
- Duration: How many years must the company sustain superior results to justify today’s valuation?
Imagine two fictional companies each earning $5 per share today. The first trades at 12× earnings ($60 per share), and the second at 30× ($150). If the first company’s EPS stagnates but the second grows earnings at 20% annually for five years, their financial profiles diverge substantially. Yet the higher-growth company still faces valuation risk: after five years, investors may assign it a lower multiple than they do today. Growth is valuable, but the price paid for growth matters just as much.
5. How earnings can grow while the stock price falls
This is one of the most important—and least intuitive—lessons in stock valuation. A company can deliver strong earnings growth and still disappoint shareholders if the market becomes less willing to pay a premium for those earnings. Economists and investors call the decline in the valuation multiple multiple compression or P/E compression.
| Metric | Year 1 | Year 2 |
|---|---|---|
| Earnings per share | $5.00 | $6.50 |
| P/E multiple | 30× | 20× |
| Implied share price | $150 | $130 |
| Change | — | EPS +30%; price −13.3% |
In this simplified scenario, the business earns 30% more per share, but the stock’s price falls from $150 to $130 because the multiple contracts from 30× to 20×. A shareholder who focuses solely on company growth may feel blindsided. Yet both variables matter mathematically: share price = EPS × P/E multiple. These numbers omit dividends, buybacks, taxes, and trading costs, but they illustrate why valuations matter even for companies performing well.
What can trigger compression? Higher real interest rates can make future earnings worth less in present-value terms. Competitors can reduce confidence in future margins. Investors may revise their growth expectations after an earnings report, or an entire market sector may fall out of favor. Sometimes nothing dramatic happens inside the company; its initial valuation was simply too demanding to support continued price appreciation.


6. PEG ratio explained: does growth justify the price?
The price/earnings-to-growth ratio, or PEG ratio, attempts to relate a P/E multiple to expected earnings growth. Its conventional formula divides P/E by the earnings growth rate expressed as a whole-number percentage—not a decimal. For example, if a stock trades at 30× earnings and its expected annual EPS growth is 15%, the PEG is 30 ÷ 15 = 2.0. If you use 0.15 instead of 15 in that conventional convention, you will produce an incorrect result.
Some introductory guides describe PEG below 1 as cheap and above 1 as expensive. That is an oversimplification. PEG comparisons are highly sensitive to the forecast growth rate, the period chosen, earnings normalization, business risk, and growth durability. A company expected to grow 30% for one year is not equivalent to one expected to sustain 30% for a decade. Further, the PEG method is generally unhelpful for companies with losses, zero growth, or persistently negative expected growth.
Consider two businesses. Company A has a P/E of 24× and expected EPS growth of 12%, producing PEG of 2.0. Company B has P/E of 30× and expected EPS growth of 25%, producing PEG of 1.2. The second appears more attractive on PEG alone, but that conclusion collapses if the 25% forecast is unrealistic. A disciplined investor uses PEG as a prompt to examine assumptions—not as an automatic buy signal.
8. P/E Ratio Explained: Seven Valuation Risks to Check
1. Negative earnings
If EPS is negative, a negative mathematical quotient is not a conventional interpretable P/E multiple. Many data services display “N/M” or exclude the stock. Screening only for low positive P/E values can therefore omit innovative but unprofitable firms—and can also omit deeply troubled companies. Profitability must be evaluated in its own right.
2. One-time gains and expenses
An asset sale can temporarily inflate net income and make a company appear cheap. A legal settlement, restructuring expense, or impairment can temporarily depress earnings and make a business appear expensive. Study the income-statement notes and reconcile reported earnings to normalized operating performance.
3. Financial leverage
Debt influences net income through interest expense and influences risk through repayment obligations. Two businesses with identical P/E ratios can have dramatically different balance-sheet resilience. Ask when debt matures, how much cash and liquidity is available, and whether operations consistently generate sufficient cash to cover interest and principal.
4. The business cycle
Cyclical businesses sometimes show the lowest P/E at peak earnings—immediately before those earnings decline. The opposite may happen near a downturn, when depressed earnings create an unusually high P/E. Comparing several years of earnings can reveal whether the denominator is representative.
5. Share-count changes
Buybacks can raise EPS even when overall net income grows slowly; stock-based compensation can dilute existing shareholders. Analyze share count, dilution, and the price paid for repurchases rather than treating EPS growth as a pure measure of operational progress.
6. Accounting does not equal cash flow
Net income includes accruals and noncash items. Sustained profits without healthy operating cash flow warrant closer investigation. Free cash flow, capital expenditure needs, working capital, and return on invested capital help determine whether accounting earnings translate into economic value.
7. Different sectors require different yardsticks
Financial institutions, REITs, utilities, and early-stage growth companies have distinct accounting structures and capital requirements. For banks, investors may analyze price-to-book and return on equity alongside earnings. For REITs, funds from operations (FFO) or adjusted FFO are often considered more informative than conventional earnings because property depreciation can distort GAAP net income. Neither adjustment removes the need to examine leverage and cash flows.
9. What P/E ratios mean for ETF investors
Even investors who never buy individual stocks are exposed to valuations through their ETFs. A broad-market fund includes firms with widely different growth profiles and earnings quality, while a technology-heavy or dividend-focused ETF may have concentrated exposures that change its portfolio’s effective earnings multiple. That is one reason two equity ETFs can behave quite differently during rising interest rates or abrupt shifts in market sentiment.
For example, a fund tracking a broad U.S. stock index and a fund with a heavy Nasdaq-100 orientation can share major constituents but assign them different weights. When investors become less willing to pay high multiples for future growth, portfolios with higher exposure to richly valued businesses may experience more pronounced multiple compression—even if many of their underlying companies continue growing earnings. This relationship is conditional, not a universal forecast.
Fund fact sheets sometimes publish portfolio P/E ratios. Check whether they use trailing or forward earnings, whether loss-making holdings are excluded, whether the statistic is weighted harmonically or calculated through another methodology, and how recently it was updated. Two figures reported by different ETF providers may not be directly comparable. Our VOO vs. QQQ research and ETF diversification guide provide additional context for concentration and portfolio composition.
P/E should also be interpreted alongside your personal asset allocation. A diversified investor deciding between equities, bonds, and cash is making decisions about expected return and risk across asset classes—not trying to find the lowest P/E fund in isolation. Good portfolio design starts with goals, time horizon, financial resilience, and the capacity to absorb losses.

10. A practical stock-valuation checklist
Before treating any stock as a bargain or an overvalued speculation, work systematically through the following questions. Write your answers down. A short written thesis makes it easier to distinguish an evidence-based decision from a market narrative that changes with each price movement.
- Which earnings measure generates the stated P/E—trailing, forward, adjusted, basic, or diluted?
- Are earnings positive and representative, or distorted by temporary gains, losses, and the business cycle?
- How does the multiple compare with carefully chosen peers using the same methodology and date?
- What level of future EPS growth must occur to justify today’s price?
- Are revenue growth, margins, reinvestment economics, and cash flow consistent with that assumption?
- How vulnerable are operations to higher rates, leverage, competition, or regulation?
- How much valuation compression could the stock withstand without producing a disappointing investor return?
- Would the company still be an attractive investment if earnings growth were slower than projected?
- Does this security fit your portfolio concentration, diversification needs, and time horizon?
For newcomers, understanding how the stock market works and how to read an ETF factsheet provides a strong foundation before digging into more advanced valuation concepts. The goal is not to predict every market movement. It is to make decisions using explicitly stated assumptions that can be checked against real results.
P/E Ratio Explained: Frequently Asked Questions
What is a good P/E ratio for a stock?
There is no universally good number. A reasonable P/E depends on sustainable earnings growth, business quality, interest rates, sector economics, and the risks investors are assuming. Compare similar businesses using consistent data, then examine whether projected growth supports the price.
Is a stock with a P/E of 10 cheaper than one with a P/E of 30?
It is cheaper relative to the specific EPS figure used. That does not establish better investment value. The 10× stock may face structural decline or peak-cycle earnings, while the 30× stock may produce stronger long-term cash flows—or may be overpriced.
Is trailing or forward P/E more useful?
Both are useful for different reasons. Trailing P/E uses historical results, while forward P/E incorporates forecasts. Evaluating both can reveal how much optimism is built into an investment thesis, provided the earnings definitions are comparable.
Why does a company have no P/E ratio?
If earnings are zero or negative, a conventional positive P/E cannot be meaningfully calculated. Some providers label it “N/M” for not meaningful. Investors may instead examine revenue quality, cash flow, assets, and pathways to sustainable profitability.
Can a stock price fall when earnings rise?
Yes. If the P/E multiple contracts more than earnings rise, the stock price can decline. For example, EPS growing from $5.00 to $6.50 while P/E falls from 30× to 20× produces a share-price change from $150 to $130.
Does PEG below 1 always mean a stock is undervalued?
No. PEG is highly sensitive to estimated earnings growth. Low PEG can reflect excessively optimistic forecasts or risk that the formula does not capture. It is an exploratory metric, not a fair-value verdict.
Can I compare P/E ratios from different websites?
Only after checking the date, EPS basis, forward forecast period, treatment of losses, and aggregation method. Differences in provider methodology can produce significantly different multiples for the same sector or fund.
P/E Ratio Explained: The Bottom Line on Earnings and Expectations
With the P/E ratio explained in context, the central lesson is to test the earnings and expectations behind any multiple. The price-to-earnings ratio remains popular for good reason: it converts a stock’s market price into an intuitive measure of what investors pay for a business’s profits. But its simplicity is also its greatest danger. A P/E ratio removes almost every piece of context that ultimately determines whether an investment succeeds.
The January 2026 industry data makes that point visible. When one industry trades at a forward multiple above 60× and another near 11×, the difference is not an automatic invitation to buy the lower number. It is a signal to investigate business models, growth expectations, capital intensity, earnings quality, and risk. And when a company delivers higher profits while its stock falls, it is a reminder that investors own both the business and the price they paid for it.
The best question is rarely “Is this P/E high or low?” It is “What future does this price require—and how confident am I that the business can deliver it?”
Interactive Stock Valuation Learning Lab
Use these tools to explore the relationships described above. They operate entirely in your browser using numbers you enter; no brokerage connection, external quote service, or login is required.
Scenario price = future EPS × selected P/E. It is not a price prediction or investment recommendation. A meaningful P/E requires positive EPS.
Growth input uses percentage points: enter 15 for 15%, not 0.15. PEG is not meaningful if P/E or projected growth is non-positive.
Continue Learning in the Invest & Compound Academy
Stock Valuation & Investing Research
Academy Library | ETF Foundations | ETF Research | Portfolio Construction
Indexes and Markets | Income and Total Return | Stock Research | Valuation
References & Official Data Sources
Primary data: Aswath Damodaran, NYU Stern, P/E Ratios by Sector (US); data as of January 2026, viewed October 2026. The industry multiples and market totals cited here reflect the source’s published values and headings. Numerical company illustrations and calculator defaults are hypothetical—not actual security recommendations. The January 2026 dataset is not a live quotation source.