IUSB vs BNDX ETF comparison
IUSB vs BNDX
IUSB holds the U.S. bond market through the wider Bloomberg U.S. Universal index, which adds high-yield and other lower-rated debt to the Aggregate, and BNDX holds investment-grade bonds issued outside the United States, with currency moves hedged back to the dollar. IUSB charges 0.06% and BNDX charges 0.07%, and both pay monthly. This page lines up what each fund holds, how sensitive each is to interest rates, what each paid and how each performed, with the date next to every number.
IUSB vs BNDX, the short answer
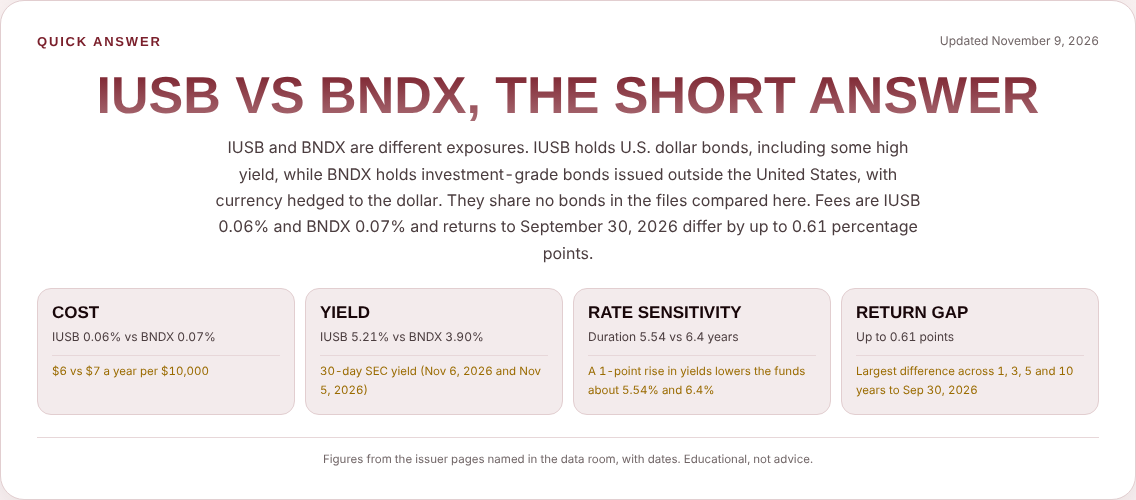
IUSB and BNDX are different exposures. IUSB holds U.S. dollar bonds, including some high yield, while BNDX holds investment-grade bonds issued outside the United States, with currency hedged to the dollar. They share no bonds in the files compared here. Fees are IUSB 0.06% and BNDX 0.07% and returns to September 30, 2026 differ by up to 0.61 percentage points.
What IUSB vs BNDX actually follow
Two funds, two indexesIUSB tracks the Bloomberg U.S. Universal Index, which holds everything in the Aggregate and adds high-yield corporate bonds, emerging-market debt and other securities. It held 18,359 lines on Nov 6, 2026.
BNDX tracks the Bloomberg Global Aggregate ex-USD Float Adjusted RIC Capped Index (USD Hedged): investment-grade bonds issued outside the United States, with currency moves hedged against the dollar. It owns 6,837 bonds from an index of 14,644, as of Sep 30, 2026. The two funds draw from different parts of the bond market, so their holdings lists are different lists.
Holdings counts are not directly comparable: some are a count of bonds, others a count of lines in a holdings file, which can include cash and futures.
IUSB vs BNDX holdings, the top 10 bond lines
The largest single bond lines in each fundThe largest bond line in IUSB is 0.50% of the fund (Nov 6, 2026) and the largest in BNDX is 0.41% (Jul 31, 2026). The lists hold different kinds of bonds: see each table. The top ten total 3.84% of IUSB and 3.47% of BNDX.
IUSB top 10 bond lines, Nov 6, 2026
| # | Security | Coupon, maturity | Weight |
|---|---|---|---|
| 1 | U.S. Treasury note ID 91282CMM0 | 4.63%, Feb 15, 2035 | 0.50% |
| 2 | U.S. Treasury note ID 91282CPJ4 | 4%, Nov 15, 2035 | 0.42% |
| 3 | U.S. Treasury note ID 91282CNT4 | 4.25%, Aug 15, 2035 | 0.41% |
| 4 | U.S. Treasury note ID 91282CDY4 | 1.88%, Feb 15, 2032 | 0.38% |
| 5 | UMBS 15-year TBA (mortgage to be announced) ID 01F0204B2 | 2%, Nov 17, 2026 | 0.37% |
| 6 | U.S. Treasury note ID 91282CQU8 | 4.13%, May 31, 2031 | 0.37% |
| 7 | U.S. Treasury note ID 91282CPZ8 | 4.13%, Feb 15, 2036 | 0.36% |
| 8 | U.S. Treasury note ID 91282CRN3 | 5%, Sep 30, 2031 | 0.35% |
| 9 | U.S. Treasury note ID 91282CCY5 | 1.25%, Sep 30, 2028 | 0.34% |
| 10 | U.S. Treasury note ID 91282CRF0 | 4.63%, Aug 15, 2036 | 0.34% |
Top 10 total 3.84% of net assets. Source: iShares holdings file.
BNDX top 10 bond lines, Jul 31, 2026
| # | Security | Coupon, maturity | Weight |
|---|---|---|---|
| 1 | United Kingdom gilt ID GB00BVP99673 | 4.125%, Mar 7, 2031 | 0.41% |
| 2 | French government bond (OAT) ID FR001400Z2L7 | 2.7%, Feb 25, 2031 | 0.37% |
| 3 | French government bond (OAT) ID FR001400HI98 | 2.75%, Feb 25, 2029 | 0.36% |
| 4 | United Kingdom gilt ID GB00BSQNRD01 | 4.375%, Mar 7, 2030 | 0.36% |
| 5 | United Kingdom gilt ID GB00BSQNRC93 | 4.375%, Mar 7, 2028 | 0.35% |
| 6 | United Kingdom gilt ID GB00BQC82B83 | 4.125%, Jul 22, 2029 | 0.34% |
| 7 | French government bond (OAT) ID FR0014012II5 | 3.5%, Nov 25, 2035 | 0.33% |
| 8 | French government bond (OAT) ID FR001400BKZ3 | 2%, Nov 25, 2032 | 0.33% |
| 9 | German federal bond (Bundesanleihe) ID DE000BU2Z064 | 2.9%, Feb 15, 2036 | 0.30% |
| 10 | United Kingdom gilt ID GB00BMF9LG83 | 4.5%, Jun 7, 2028 | 0.30% |
Top 10 total 3.47% of net assets. Source: SEC Form N-PORT, filed Sep 28, 2026 (fund-level, all share classes).
The two lists are dated differently on purpose, because each issuer publishes holdings on its own schedule: IUSB Nov 6, 2026 (iShares holdings file); BNDX Jul 31, 2026 (SEC Form N-PORT, filed Sep 28, 2026 (fund-level, all share classes)). IUSB’s list includes a mortgage security sold on a to-be-announced basis (TBA), which is a forward purchase of a pool of mortgages rather than a single named bond.
IUSB vs BNDX overlap, shared holdings
Matched bond by bond on CUSIP or ISINNo bond appears in both funds. I matched 16,434 distinct identifiers in IUSB (Nov 6, 2026) against 6,821 in BNDX (Jul 31, 2026), using CUSIP codes and, for international bonds, ISIN codes, and found no match. That is what the index descriptions predict: BNDX holds bonds issued outside the United States, and the other fund holds U.S. issuers. Holding both would add a separate source of bond exposure rather than repeat the same bonds.
IUSB vs BNDX sector mix
Where the money sits, in standard categoriesCorporate bonds split three ways
Each issuer uses its own labels (IUSB: Sector (iShares label), Nov 6, 2026; BNDX: Distribution by issuer (Vanguard label), Sep 30, 2026). This page groups them into common categories: “Treasury and agency” adds Treasury, agency and government lines; corporate adds industrial, financial and utility bonds; “Other and cash” holds the remainder.
IUSB vs BNDX maturity profile
How long the bonds have left to runVanguard’s BNDX fact sheet gives an average effective maturity (8.2 years) and duration (6.4 years) but no table of maturity bands, so a band-by-band comparison is not possible here and nothing has been estimated. Average maturity is 7.96 years for IUSB and 8.2 years for BNDX, which is 0.2 years apart; duration is 5.54 and 6.4 years.
Average maturity: IUSB Nov 6, 2026, BNDX Sep 30, 2026. Maturity bands are shown on other comparisons on this site where both funds publish them.
IUSB vs BNDX credit quality
Two reporting methods, not necessarily two risk levelsIUSB · Nov 6, 2026
| Rating | Share |
|---|---|
| AAA | 2.3% |
| AA | 64.0% |
| A | 13.5% |
| BBB | 13.2% |
| BB | 3.6% |
| B | 2.1% |
| CCC | 0.4% |
| CC, C and D | 0.0% |
| Not rated | 0.0% |
| Cash and derivatives | 0.7% |
BNDX · Sep 30, 2026
| Rating | Share |
|---|---|
| AAA | 25.7% |
| AA | 17.2% |
| A | 36.9% |
| BBB | 18.5% |
| Not rated | 1.7% |
IUSB vs BNDX interest rate sensitivity
Duration is the number that matters mostDuration estimates how much a bond fund’s price moves when yields change. A duration of 5.54 years means a rise of one percentage point in yields would lower the price by about 5.54%, and a fall of one point would raise it by about the same.
IUSB reports effective duration of 5.54 years (Nov 6, 2026); BNDX reports average duration of 6.4 years (Sep 30, 2026). That is a difference of 0.86 years, which is large enough to matter: the fund with the higher duration will move more when yields change.
| If yields change by | IUSB price effect | BNDX price effect |
|---|---|---|
| −2 points | +11.08% | +12.80% |
| −1 point | +5.54% | +6.40% |
| −0.5 points | +2.77% | +3.20% |
| +0.5 points | -2.77% | -3.20% |
| +1 point | -5.54% | -6.40% |
| +2 points | -11.08% | -12.80% |
Estimate: price change ≈ −duration × change in yield, applied to $10,000. It ignores interest income, convexity, spread changes and trading costs, so real results will differ. IUSB reports convexity of 0.45 and an option-adjusted spread of 53.92 basis points (Nov 6, 2026); the other fund’s fact sheet does not list either figure.
IUSB vs BNDX yield and monthly income
What each fund paid| Measure | IUSB | BNDX |
|---|---|---|
| 30-day SEC yield | 5.21% · Nov 6, 2026 | 3.90% · Nov 5, 2026 |
| Yield to maturity | 5.41% · Nov 6, 2026 | 5.23% · Nov 5, 2026 |
| Trailing 12-month yield | 4.33% ($1.95 per share) · Nov 9, 2026 | 4.64% ($2.21 per share) · Nov 9, 2026 |
| Average coupon | 4.11% | 2.8% |
The 30-day SEC yield is the standard way to compare bond funds because every fund calculates it the same way, after expenses. IUSB showed 5.21% and BNDX showed 3.90%, a gap of 1.31 points. The two figures are dated Nov 6, 2026 and Nov 5, 2026, and market yields can change in between, so the comparison is approximate. Yield to maturity is shown with its date where the issuer publishes it.
Trailing 12-month yield is a record of what was paid, not a forecast: 4.33% for IUSB and 4.64% for BNDX. BNDX paid an unusually large distribution of $0.9686 on Dec 18, 2025, well above its usual monthly amount, which lifts its trailing 12-month yield. BNDX’s yield is after the cost of hedging currency, which is one reason it sits below the U.S. funds.
Monthly payouts per share, newest first
| Ex-dividend date | IUSB | BNDX |
|---|---|---|
| Nov 2, 2026 | $0.1718 | $0.1200 |
| Oct 1, 2026 | $0.1544 | $0.1140 |
| Sep 1, 2026 | $0.1680 | $0.1206 |
| Aug 3, 2026 | $0.1686 | $0.1185 |
| Jul 1, 2026 | $0.1640 | $0.1112 |
| Jun 1, 2026 | $0.1511 | $0.1141 |
| May 1, 2026 | $0.1629 | $0.1126 |
| Apr 1, 2026 | $0.1645 | $0.1117 |
| Mar 2, 2026 | $0.1573 | $0.0998 |
| Feb 2, 2026 | $0.1650 | $0.1124 |
| Dec 19, 2025 | $0.1648 | $0.9686 |
| Dec 1, 2025 | $0.1565 | $0.1044 |
Third-party payout history (StockAnalysis, Nov 9, 2026), the 12 most recent payouts listed, which include two in December 2025 and none dated January 2026. Per-share amounts differ because the funds have different share prices (about $45 against $48), so compare yields, not dollars per share. Bond fund payouts change from month to month with the income the fund earns.
IUSB vs BNDX returns
NAV total returns from the issuersAverage annual returns to September 30, 2026
| Period | IUSB | BNDX | Gap (points) |
|---|---|---|---|
| 1 year | -1.53% | -0.92% | -0.61 |
| 3 years | +4.49% | +3.90% | +0.59 |
| 5 years | -0.28% | -0.06% | -0.22 |
| 10 years | +1.46% | +1.30% | +0.16 |
Calendar-year returns
| Year | IUSB | BNDX | Gap (points) |
|---|---|---|---|
| 2021 | -1.28% | -2.20% | +0.92 |
| 2022 | -13.01% | -12.87% | -0.14 |
| 2023 | +6.20% | +8.87% | -2.67 |
| 2024 | +2.13% | +3.68% | -1.55 |
| 2025 | +7.47% | +3.00% | +4.47 |
Net asset value (NAV) total returns, with distributions reinvested, from iShares fund page and holdings file (Nov 6, 2026) for IUSB and Vanguard fact sheet (Sep 30, 2026) and fund page for BNDX. Past performance does not guarantee future results. The funds launched in different years (IUSB Jun 10, 2014, BNDX May 31, 2013), so since-inception figures (1.93% and 2.20%) cover different periods and are not compared here.
IUSB vs BNDX expense ratio, size and trading
Cost of owning each fund| Item | IUSB | BNDX |
|---|---|---|
| Expense ratio | 0.06% | 0.07% |
| Yearly cost per $10,000 | $6 | $7 |
| Net assets (ETF class) | $50.47B · Nov 9, 2026 | $85.43B · Nov 9, 2026 |
| Shares outstanding | 1.12B | 1.79B |
| Closing price | $44.94 · Nov 6, 2026 | $47.59 · Nov 6, 2026 |
| 52-week range | $43.75 to $47.23 | $46.63 to $49.73 |
| Premium or discount | 0.06% premium on Nov 6, 2026 | $0.06 premium (0.13%) on Nov 6, 2026 |
| Median bid/ask spread | Not captured | Not captured |
| Portfolio turnover | 65.0% · FY ended Oct 31, 2025 | 23.0% · Sep 30, 2026 fact sheet |
| Exchange | Nasdaq | Nasdaq |
BNDX charges 0.01 percentage points more, which is $1 a year more on $10,000. Both funds are large ($50.47B and $85.43B), and large funds usually trade with tight spreads. BNDX’s assets above are the ETF share class only; Vanguard reports $121.7B (Sep 30, 2026) across all share classes of the fund.
Neither fund’s fee is likely to be the largest cost of owning it: the choice of how much to hold in bonds, and for how long, matters far more than a few hundredths of a percent.
IUSB vs BNDX, which fits which job
Characteristics, not recommendationsRisks of IUSB and BNDX
What can go wrongShared risks
- Interest rate risk: with durations of 5.54 and 6.4 years, a one-point rise in yields lowers the funds by roughly 5.54% and 6.4%.
- Credit risk is low but not zero, with 31% and 15% of the funds in corporate bonds.
- Inflation risk: bond income and principal are not inflation-protected.
Fund-specific points
- IUSB holds about 6.2% below investment grade, which adds credit risk the Aggregate funds do not carry.
- IUSB charges 0.06%, double the 0.03% of the core Aggregate funds.
- BNDX is exposed to foreign government and issuer risk, and hedging currency back to the dollar has a cost that reduces its yield and is not perfect.
- BNDX charges 0.07%, the highest fee of the six funds in this series.
- Dates differ: IUSB data is from Nov 6, 2026 and BNDX data from Sep 30, 2026.
- Neither fund guarantees its payout, which changes each month.
IUSB vs BNDX taxes and account placement
General education, not tax adviceInterest from bond funds is generally taxed as ordinary income rather than at the lower rates that apply to qualified dividends, and the monthly distributions of these funds are mostly interest. For that reason many investors hold taxable bond funds in tax-advantaged accounts, such as retirement accounts, when they have the choice.
Some interest from U.S. Treasuries can be exempt from state income tax; how much of each fund’s income qualifies is reported by the issuer after year-end and varies by fund and year. BNDX holds foreign bonds, so part of its income can come with foreign tax considerations that differ from the U.S. funds; check the issuer’s tax reporting.
Canadian and other non-U.S. investors face their own rules, including currency conversion and withholding considerations, and should check them before buying a U.S.-listed fund.
IUSB vs BNDX key terms
Plain-language definitionsIUSB vs BNDX data room
Evidence grade: Issuer issuer document · Mixed issuer plus provider · 3rd partyEvery figure on this page, with its source, date and evidence grade. Open the issuer documents before relying on any number.
| Item | IUSB | BNDX | Source | As of | Grade |
|---|---|---|---|---|---|
| Expense ratio | 0.06% | 0.07% | Issuer fund pages and fact sheets | Latest published | Issuer |
| 30-day SEC yield | 5.21% | 3.90% | Issuer fund pages and fact sheets | Nov 6, 2026 / Nov 5, 2026 | Issuer |
| Yield to maturity | 5.41% | 5.23% | Issuer fund pages and fact sheets | Nov 6, 2026 / Nov 5, 2026 | Issuer |
| Duration | 5.54 yrs | 6.4 yrs | Issuer fund pages and fact sheets | Nov 6, 2026 / Sep 30, 2026 | Issuer |
| Average maturity | 7.96 yrs | 8.2 yrs | Issuer fund pages and fact sheets | Nov 6, 2026 / Sep 30, 2026 | Issuer |
| Bonds held | 18,359 | 6,837 | Issuer fund pages and fact sheets | Nov 6, 2026 / Sep 30, 2026 | Issuer |
| Sector, maturity, credit mix | See tables | See tables | Issuer fund pages and fact sheets | Nov 6, 2026 / Sep 30, 2026 | Issuer |
| Top 10 holdings and overlap | 18,369 lines | 7,380 lines | iShares holdings file / SEC Form N-PORT, matched by CUSIP or ISIN | Nov 6, 2026 / Jul 31, 2026 | Issuer |
| Returns (NAV) | See tables | See tables | Issuer fund pages and fact sheets | Sep 30, 2026; calendar years to 2025 | Issuer |
| Net assets, shares, 52-week range, beta | $50.47B, 1.12B | $85.43B, 1.79B | StockAnalysis | Nov 9, 2026 | 3rd party |
| Trailing 12-month yield and payouts | 4.33% | 4.64% | StockAnalysis | Nov 9, 2026 | 3rd party |
| Closing price | $44.94 | $47.59 | Issuer fund pages and StockAnalysis | Nov 6, 2026 | Mixed |
IUSB vs BNDX documents and sources
Open the issuer documents before relying on any figureIUSB · BlackRock iShares
Third-party sources
StockAnalysis, IUSB · StockAnalysis, BNDX.
Methodology and limits
- Issuer figures are shown with their own dates. Where the two funds report on different dates the page says so and does not mix them silently.
- Sector and maturity overlap are this page’s sums of the smaller weight in each common category, and are approximate because issuers use different labels.
- Holdings overlap matches bonds by CUSIP or ISIN between the two holdings files named above; bonds without an identifier cannot be matched.
- Figures that were unavailable are marked as such, and nothing was filled from memory or from another fund.
- Rate-sensitivity figures are estimates from reported duration only.
IUSB vs BNDX, frequently asked questions
Answers use the figures and dates shown aboveIUSB vs BNDX, which is better?
Neither is better in general, because they do different jobs. IUSB holds the U.S. bond market through the wider Bloomberg U.S. Universal index, which adds high-yield and other lower-rated debt to the Aggregate, while BNDX holds investment-grade bonds issued outside the United States, with currency moves hedged back to the dollar. The right one depends on the role bonds play in a portfolio, the investor’s tolerance for interest-rate and credit risk, and the account used.
IUSB vs BNDX, what is the difference in fees?
IUSB charges 0.06% and BNDX charges 0.07%, a difference of 0.01 percentage points, or $1 a year on $10,000.
IUSB vs BNDX, which has the higher yield?
IUSB showed a 30-day SEC yield of 5.21% on Nov 6, 2026 and BNDX showed 3.90% on Nov 5, 2026. The gap is 1.31 points; the dates differ, so the comparison is approximate.
IUSB vs BNDX, how much do they fall if rates rise?
By duration, about 5.54% for IUSB and 6.4% for BNDX for each one-point rise in yields, before counting the interest each fund earns. This is an estimate, not a forecast.
IUSB vs BNDX, do they hold the same bonds?
No. The holdings files compared here share no bonds at all, because the funds draw from different parts of the bond market. The sector overlap on this page is about 22%.
BNDX vs IUSB, does the order change the comparison?
No. BNDX vs IUSB and IUSB vs BNDX describe the same pair of funds, and every figure on this page applies either way. The order only decides which fund is listed first.
IUSB vs BNDX, can I own both?
You can. The two funds hold different exposures, with an overlap of 0%, so owning both gives a different mix from owning either alone.
IUSB vs BNDX, are they suitable for Canadian investors?
Both are U.S.-listed and trade in U.S. dollars, so Canadians face currency conversion costs and should check how interest income is taxed in their account type before buying.
Educational research, not personalized investment, tax or legal advice, and not a recommendation to buy or sell any fund. Investing involves risk, including loss of principal. Past performance does not guarantee future results. The rate-sensitivity illustration is a hypothetical estimate. Fund data are provided as published by the sources named and may differ from current figures.