Why Bond Prices Fall When Interest Rates Rise
See how changing market yields affect fixed bond payments, with an exact five-year pricing example and clear explanations of duration and total return.
By Greg Roman · Educational guide · Original hypothetical examples in USD
Why bond prices fall when interest rates rise becomes clearer when you compare competing cash flows. Five useful checks are the fixed payments, required market yield, remaining maturity, duration and the investor’s full holding-period result.
A bond can keep paying interest on schedule while the value shown in your account falls. That can feel contradictory. If the borrower has not changed the payment arrangement, why should an investment described as fixed income suddenly be worth less?
The answer begins with a distinction between a contract and a market price. The contract determines the payments the issuer owes. The market price reflects what buyers will pay for those payments today. When comparable alternatives offer different returns, the old contract must compete with them.
Understanding why bond prices fall when interest rates rise helps you interpret account statements, compare funds and plan around money you may need before maturity. It also helps explain why a high-quality bond portfolio can experience a difficult year without widespread defaults. All examples here are hypothetical, use USD and exclude taxes and trading costs unless specified.
Start with competing payment streams
Imagine a non-callable bond with $1,000 face value, five years remaining and a fixed annual coupon of $40. For simplicity, assume annual payments and that the next coupon is exactly one year away. The issuer owes five coupon payments and the $1,000 principal payment at the end of year five.
If investors require a 4% annual yield for that exact risk and payment schedule, those payments are worth $1,000 today. Now suppose the required yield rises to 5%. Buyers can seek better compensation elsewhere, so the same future payments need a lower purchase price to provide the new required return.
Nothing in this example changes the $40 coupon. The adjustment happens in the price paid for the remaining cash flows. The lower price creates additional compensation through the difference between purchase price and principal repayment.
This is not a penalty imposed by the issuer. It is how a market compares payment streams across time. A loan made under yesterday’s conditions can still be a valid contract while becoming less valuable to a new buyer under today’s conditions.
An exact five-year pricing example
To value the illustrated bond, discount each future payment using the assumed required yield. The formula is the sum of $40 divided by (1 + yield) raised to the payment year, plus $1,000 divided by (1 + yield) raised to year five.
| Assumed annual required yield | Price of the illustrated bond | Change from $1,000 |
|---|---|---|
| 3% | $1,045.80 | +4.58% |
| 4% | $1,000.00 | 0.00% |
| 5% | $956.71 | −4.33% |
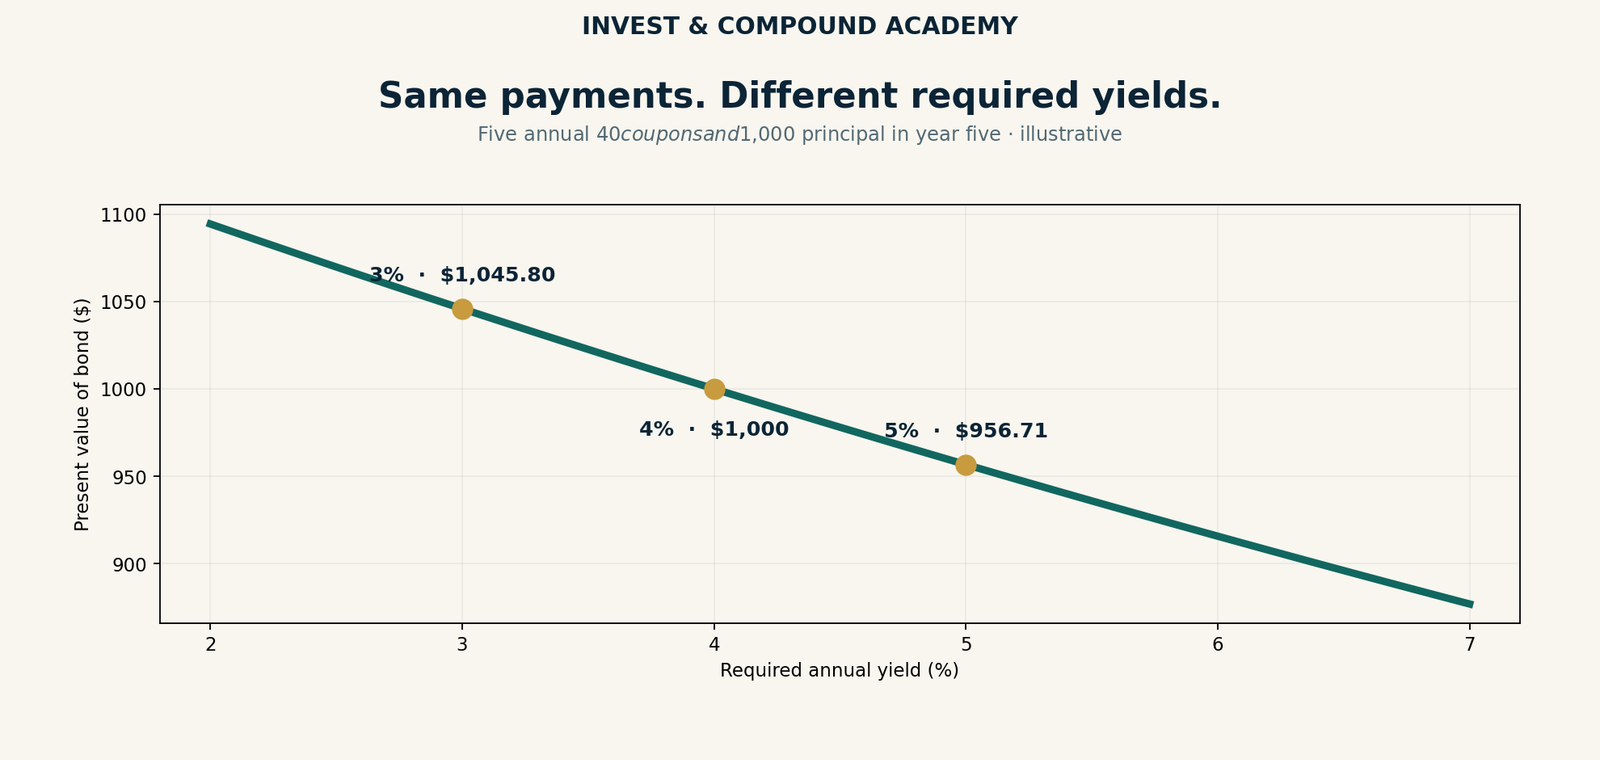
These values hold the remaining term and payment dates constant. They describe alternative valuations at the same moment, not an account’s performance over a year. That distinction matters because time passing, coupons received and reinvestment would affect a real holding-period return.
The example also uses annual compounding and annual coupons. Many actual bonds pay semiannually and use market conventions that require a different calculation. The purpose is to make the relationship visible, not to replace a broker’s security-specific pricing calculation.
Notice that the gain when yields decline by one percentage point is not exactly equal to the loss when they rise by one point. The relationship between bond price and yield is curved. We will return to that feature when discussing the limits of duration estimates.
Which interest rate are we talking about?
Financial headlines often refer to a central bank’s policy rate. An individual bond is priced against the yield investors require for its particular cash flows and risks. These rates are related, but they are not identical.
A ten-year government bond reflects conditions across a longer period than an overnight policy rate. A corporate bond adds compensation for credit risk and other features. Its yield can rise even when a central bank leaves its policy rate unchanged.
Suppose a corporate bond’s comparable government yield stays at 4%, but the market’s required additional credit compensation rises from one percentage point to two. The corporate bond’s required yield can move from 5% to 6%. Its price may fall because the issuer has become less attractive to lenders or because investors generally demand more compensation for corporate exposure.
Before explaining a loss as interest-rate risk, identify which required yield changed. The government curve, credit spread and liquidity conditions may have contributed differently. A single headline rarely captures every source of movement in a diversified bond fund.
Maturity is a date; duration is sensitivity
Maturity tells you when principal is scheduled to be repaid. Duration helps describe price sensitivity to a change in yields. They are related, but they answer different questions.
For a conventional coupon bond, some money arrives before maturity through interest payments. The timing of those earlier cash flows affects sensitivity. A zero-coupon bond concentrates its payment at maturity and has different characteristics from a coupon-paying bond with the same final repayment date.
Modified duration provides a local estimate of the percentage price change for a small change in yield. Effective duration is commonly used when cash flows can change, such as with embedded options. Fund providers may report different measures, so read the definition rather than treating every duration number as interchangeable.
An illustrative bond with duration of six years might experience an approximately 3% price decline if the relevant yield rises by 0.5 percentage point. The calculation is minus duration multiplied by the yield change expressed as a decimal: −6 × 0.005 = −0.03.
That estimate concerns price, not total return. It does not add coupons, fees, credit events or currency movements. It is also an approximation around current conditions. A large yield move or changing cash flows can make a simple duration estimate less reliable.
Percentage points are not percentage changes
Rate language can create avoidable confusion. A yield moving from 4% to 5% rises by one percentage point, or 100 basis points. Relative to its starting value, that is a 25% increase in the yield number. Duration calculations use the one-percentage-point change, expressed as 0.01.
If a bond’s duration is six, multiplying six by 25% would be the wrong operation for this scenario. The rough price estimate is a 6% decline before accounting for curvature and other factors, not a 150% decline.
Record the starting yield, ending yield and difference when doing an exercise. Writing those three numbers prevents confusion between a percentage-point move and a relative percentage increase. It also makes the scenario easier to check later.
Why longer bonds often move more
Payments far in the future are generally more sensitive to changes in the discount rate. A small change applied over many years can meaningfully change present value. This is why longer-maturity fixed-rate bonds typically have greater interest-rate sensitivity than otherwise similar shorter ones.
But maturity alone is not a complete ranking system. Coupon size, call provisions and the shape of the yield curve can affect sensitivity. Comparing a short corporate bond with a long government bond adds credit differences to the maturity comparison.
For a fund, inspect the reported duration alongside its holdings and strategy. A portfolio described as government bonds may carry substantial duration exposure. High credit quality addresses one source of risk; it does not eliminate sensitivity to market yields.
The practical question is whether that sensitivity fits the money’s purpose. A price decline may be manageable for an investor with a flexible long horizon. It can be disruptive for someone who expected to sell fund shares next month to meet a fixed bill.
Convexity explains why the simple estimate has limits
The bond-price relationship is usually curved rather than a straight line. Convexity captures part of that curvature. For a plain non-callable bond with positive convexity, a duration-only estimate tends to understate gains when yields fall and overstate losses when yields rise, all else equal.
That is not a universal guarantee. Callable bonds and mortgage-related securities can behave differently because borrowers may repay earlier when conditions change. Their expected cash flows can shift at the same time as yields.
You do not need to calculate convexity to recognize the boundary of a simplified tool. Use duration as a first approximation, then consult the security or fund documentation for features that affect cash flows. Avoid presenting a rough estimate as an exact forecast.
In the five-year table above, the unequal up and down movements provide a concrete reminder. Even with fixed payments and no default assumption, a one-point move in each direction does not create perfectly symmetric price changes.
A price loss and a total return are different
Suppose an investor starts with a hypothetical bond worth $10,000, receives $400 in coupons during a year and finishes with a market value of $9,500. Ignoring reinvestment and costs, the ending value plus income is $9,900. The holding-period total return is −1%.
The price change alone is −5%. Quoting only the coupon would suggest +4%. Both figures omit part of the result. Combining income and price movement gives a more useful account of what happened.
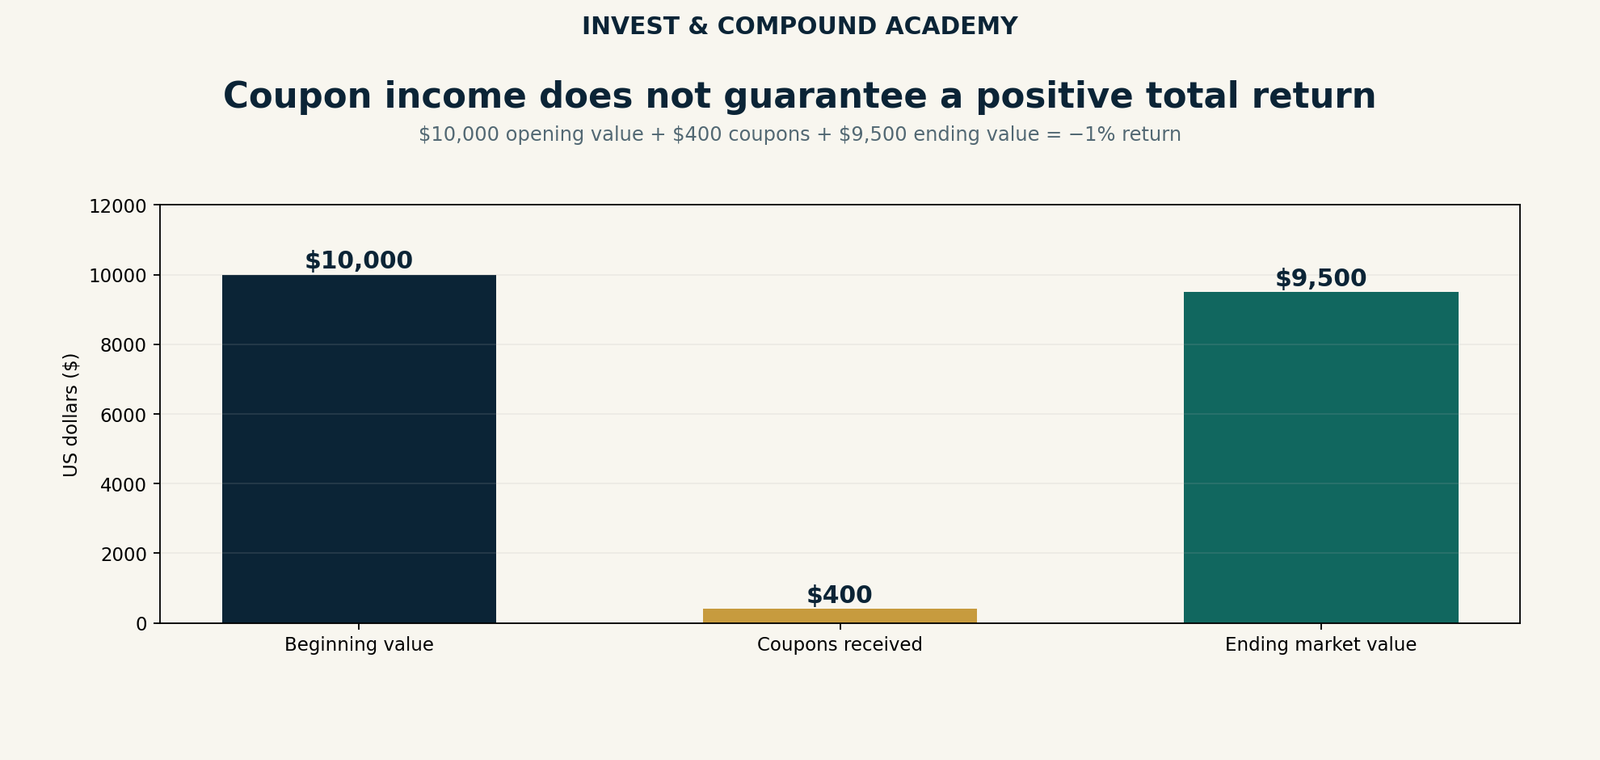
For a fund, distributions likewise belong alongside the change in share value. A distribution is not extra wealth independent of the fund’s assets. Use total-return data with a stated methodology when comparing performance, and keep your own contribution and withdrawal history separate from fund returns.
This distinction also prevents a common misunderstanding: receiving interest does not prove that the investment has produced a positive overall return. Income can soften a price decline while leaving the total result negative.
Does holding to maturity solve the problem?
For an individual non-callable bond that pays as promised, holding to maturity removes the need to sell at an interim market price. You receive the contractual principal amount, which may differ from the price you originally paid.
That can be valuable when the payment date matches a planned obligation. It does not remove default risk, inflation risk or the opportunity cost of locking money into an older coupon. It also assumes you can wait without redirecting the money to another need.
For a conventional bond ETF, there generally is no single shareholder maturity date. The fund owns bonds that mature and typically replaces securities to continue its strategy. Waiting a fixed number of years does not create a contractual guarantee that your ETF purchase price will be returned.
The distinction is structural, not a verdict that one form is better. Individual bonds and funds can serve different goals. What matters is understanding which payment arrangement you actually own.
Falling yields can create another challenge
When yields fall, existing fixed-rate bonds often gain market value. That can look favorable, but it also changes opportunities for investing new money. Future coupons or principal repayments may need to be reinvested at lower yields.
Someone living on interest can therefore experience a trade-off: current holdings rise in price while replacing their income becomes harder. A callable issuer may also redeem debt under its contractual rights, returning money sooner than the investor expected.
For someone still adding to a bond portfolio, higher yields can improve the available compensation on new purchases while reducing the value of existing holdings. The overall effect depends on the time horizon and future cash flows.
These relationships are why a bond plan should include both current valuation and future reinvestment. An account statement is one snapshot; the spending arrangement may extend across many years.
A useful way to review a bond fund
Begin with the strategy rather than the recent price chart. Identify the currencies, issuer types, duration measure and credit quality. Read whether derivatives, leverage or embedded options materially affect exposure.
Then compare the fund’s job with your goal. Is it supporting near-term spending, providing a portfolio diversifier or taking an active view on rates? Each role can imply different tolerance for price movement.
Write an original stress test rather than a prediction. For example, use the duration estimate to inspect a half-point yield increase, then add a separate credit-spread scenario where relevant. Keep the limitations visible and do not assume a uniform curve shift describes every market event.
Finally, distinguish a changed strategy from an unchanged strategy doing what its documents described. A loss deserves investigation, but a negative return alone does not establish that a fund failed its mandate.
Questions readers often ask
Will every bond fall when the central bank raises rates?
No. Markets may already anticipate a decision, and different securities respond to different yields and risks. The inverse price-yield relationship describes the effect of a higher required yield on fixed cash flows, holding other inputs constant.
Is duration the number of years until maturity?
No. Duration measures or summarizes sensitivity and cash-flow timing, depending on the definition. Maturity is the scheduled final repayment date.
Can a government bond fund lose money?
Yes. High credit quality does not remove interest-rate risk. A fund with substantial duration can experience meaningful price changes as yields move.
Does a higher yield after a price decline undo my loss?
Not immediately. A new yield describes compensation available at the new price under assumptions. Your eventual result depends on subsequent payments, valuation, holding period and costs.
Connect the rate story with your own timeline
Knowing why bond prices fall when interest rates rise makes the account statement easier to interpret. The next step is connecting that mechanism with the date you need the money and the structure you own.
A fixed coupon is a payment promise. A duration number is a sensitivity estimate. A market price is today’s valuation. Keeping those three concepts separate makes it easier to ask useful questions without treating a headline rate decision as a complete investment plan.
Educational information only. Examples are hypothetical and are not recommendations or forecasts. Investing involves risk, including loss of principal.
Why bond prices fall when interest rates rise: Fixed cash-flow price calculator
Annual coupon and compounding convention. Next payment is one year away. No default, call, accrued interest, tax or trading costs. This is a valuation exercise, not a market quote.
Continue Learning in the Invest & Compound Academy
Build on these bond-pricing concepts with related research guides.
Bonds, rates and fixed income
How bonds work | Bond prices and rates | Bond yield | Government vs corporate | Bond ETFs vs bonds | Bond ladders | Best bond ETFs
Sources and example notes
Primary educational references support the concepts. Numerical scenarios and worksheets are original hypothetical examples, not current quotes or forecasts.