DVY vs SCHD ETF comparison
DVY vs SCHD
DVY tracks the Dow Jones U.S. Select Dividend Index and holds about 98 high-yielding U.S. stocks, with financials and utilities as its largest sectors, at the highest fee in this group, and SCHD tracks the Dow Jones U.S. Dividend 100 Index, about 100 large U.S. companies chosen for dividend quality.
DVY is built around high dividend yield and SCHD around dividend quality, so they own different stocks and weight sectors differently. Both track an index and pay quarterly distributions. DVY charges 0.38% and SCHD charges 0.06%. This page lines up what each fund owns, how the two overlap, what each costs, how each has performed against its index and how each trades, with the date next to every number.
DVY vs SCHD, the short answer
DVY and SCHD are both U.S. dividend ETFs that track an index and pay distributions quarterly. DVY is built around high dividend yield and SCHD around dividend quality, so they own different stocks and weight sectors differently. Both track an index and pay quarterly distributions. Expense ratios are 0.38% and 0.06%, which is $38 and $6 a year per $10,000.
NAV total returns, annualized (both to Sep 30, 2026): 1 year 10.80% vs 23.36%; 3 years 16.35% vs 15.44%; 5 years 9.68% vs 9.48%. Their top ten holdings overlap by 0.0% and their sector weights overlap by about 55%. Neither is better for everyone; the choice turns on cost, yield, concentration and which sectors you want to own.
Want the full picture of one fund before you compare? Read the complete guide for each fund: DVY guide and SCHD guide. Each guide covers fees, holdings, yield, returns and taxes.
DVY vs SCHD overlap, if you own both
DVY · ten largest holdings
As of Nov 9, 2026- 1Pfizer PFE2.36%Only here
- 2Altria Group Inc. MO2.33%Only here
- 3Prudential Financial Inc. PRU2.24%Only here
- 4HP Inc. HPQ2.13%Only here
- 5T. Rowe Price Group TROW2.12%Only here
- 6Target Corp TGT1.75%Only here
- 7Verizon Communications Inc. VZ1.72%Only here
- 8ONEOK OKE1.68%Only here
- 9Kimberly Clark KMB1.65%Only here
- 10Best Buy BBY1.64%Only here
Ten largest total 19.6%
SCHD · ten largest holdings
As of Nov 5, 2026- 1Procter & Gamble PG4.45%Only here
- 2Home Depot HD4.32%Only here
- 3Texas Instruments TXN4.29%Only here
- 4Coca-Cola KO4.27%Only here
- 5Amgen AMGN4.09%Only here
- 6Abbott Laboratories ABT4.04%Only here
- 7PepsiCo PEP3.99%Only here
- 8Chevron CVX3.95%Only here
- 9UnitedHealth Group UNH3.89%Only here
- 10ConocoPhillips COP3.88%Only here
Ten largest total 41.2%
Shared by both · 0 companies
| Company | DVY weight | SCHD weight | Gap |
|---|
Only in DVY’s top ten: Pfizer, Altria Group Inc., Prudential Financial Inc., HP Inc., T. Rowe Price Group, Target Corp, Verizon Communications Inc., ONEOK, Kimberly Clark, Best Buy. Only in SCHD’s top ten: Procter & Gamble, Home Depot, Texas Instruments, Coca-Cola, Amgen, Abbott Laboratories, PepsiCo, Chevron, UnitedHealth Group, ConocoPhillips.
The twist
0 of the ten largest holdings are shared, and the overlap is 0.0% by the smaller-weight method. Sector weights overlap by about 55%, so the portfolios can still look alike beyond the top ten.
DVY vs SCHD, one goal, which fund?
DVY vs SCHD, where the money goes
DVY · iShares Select Dividend ETF
SCHD · Schwab U.S. Dividend Equity ETF
DVY vs SCHD returns compared over 1, 3 and 5 years
DVY vs SCHD, what each fund costs a year
The data room
Every figure behind the DVY vs SCHD cards above, with its source, date and evidence grade. Open the issuer documents before relying on any number.
DVY vs SCHD key facts
Evidence grade: Issuer issuer page · Mixed issuer plus provider · 3rd party| Metric | DVY | SCHD | Grade and source |
|---|
Portfolio characteristics
| Metric | DVY | SCHD | Grade and source |
|---|
Net assets are dated Nov 10, 2026 for DVY and Nov 6, 2026 for SCHD (DVY $23.68B; SCHD $119.9B). Figures an issuer page does not show are left out or marked Not captured, not estimated.
DVY vs SCHD holdings, how each fund is built
Issuer pages · Sep 30 to Nov 10, 2026| Item | DVY | SCHD |
|---|---|---|
| Strategy | Tracks the Dow Jones U.S. Select Dividend Index, relatively high dividend yielding U.S. stocks | Tracks the Dow Jones U.S. Dividend 100 Index, about 100 large U.S. companies chosen for dividend quality and sustainability |
| Number of holdings | 98 (Nov 9, 2026) | 102 (Nov 5, 2026) |
| Top ten share of fund | 19.6% | 41.2% |
| Reference index | Dow Jones U.S. Select Dividend Index | Dow Jones U.S. Dividend 100 Index |
| Exchange | NASDAQ | NYSE Arca |
| Launched | Nov 3, 2003 | Oct 20, 2011 |
Gaps are marked Not captured. Number of holdings and top-ten weights carry the date shown, which differs by issuer.
DVY vs SCHD against their indexes, tracking and cost
NAV total return vs index, to Sep 30, 2026| Fund and period | Fund NAV | Index | Index return | Fund minus index, pts |
|---|---|---|---|---|
| DVY · 1 year | 10.80% | Dow Jones U.S. Select Dividend Index | 11.24% | -0.44 |
| DVY · 3 years | 16.35% | Dow Jones U.S. Select Dividend Index | 16.79% | -0.44 |
| DVY · 5 years | 9.68% | Dow Jones U.S. Select Dividend Index | 10.11% | -0.43 |
| SCHD · 1 year | 23.36% | Dow Jones U.S. Dividend 100 Index | 23.48% | -0.12 |
| SCHD · 3 years | 15.44% | Dow Jones U.S. Dividend 100 Index | 15.53% | -0.09 |
| SCHD · 5 years | 9.48% | Dow Jones U.S. Dividend 100 Index | 9.56% | -0.08 |
What you actually own
DVY vs SCHD performance
Matched dates, to Sep 30, 2026All rows come from the issuer pages and are dated Sep 30, 2026 for both funds, so they compare like for like. NAV returns include fees. “Since inception” starts in different years (DVY 2003, SCHD 2011). Past performance does not guarantee future results.
Growth of a hypothetical $10,000 · NAV total return, to Sep 30, 2026
Derived from issuer NAV total returns (compounded). Fund expenses are already in NAV. Illustration, not a forecast.
DVY vs SCHD yield, dividends and dividend growth
Yield and distribution facts| Measure | DVY | SCHD |
|---|---|---|
| 30-day SEC yield | 3.66% (Sep 30, 2026) | 3.12% (Nov 5, 2026) |
| Trailing yield | 3.51% (Sep 30, 2026) | 3.24% (Sep 30, 2026) |
| Distributions | Quarterly | Quarterly |
| Fee per $10,000 a year | $38 | $6 |
The yield figures are not directly comparable by date or definition. DVY shows a 30-day SEC yield of 3.66% (Sep 30, 2026) and a trailing yield of 3.51% (Sep 30, 2026); SCHD shows 3.12% (Nov 5, 2026) and 3.24% (Sep 30, 2026). A trailing yield looks back at what the fund paid, while the SEC yield is a standard formula based on the latest 30 days.
A high yield is not the same as a high return: compare it with the NAV total return. See what is dividend yield, yield vs total return and high dividend yield.
DVY vs SCHD trading and liquidity
Issuer fund pages · Nov 2 to Nov 10, 2026DVY trades on NASDAQ and SCHD on NYSE Arca. Spreads on the issuer pages were 0.03% for DVY and 0.03% for SCHD, and a spread of 0.02% is about $20 between the buy and sell price on $100,000. Larger funds usually trade with tighter spreads, which matters more for frequent traders than for long-term holders. Use limit orders for large trades and avoid the first and last minutes of the session. See creation, redemption and trading for how NAV, premiums and spreads arise.
DVY vs SCHD expense ratio and fees in dollars
As stated by each issuer| Balance | DVY (0.38%) | SCHD (0.06%) | Gap per year |
|---|---|---|---|
| $10,000 | $38 | $6 | $32 |
| $50,000 | $190 | $30 | $160 |
| $100,000 | $380 | $60 | $320 |
The expense ratio is taken from fund assets, not billed to you. Fees exclude the bid/ask spread, any premium or discount to NAV, brokerage commissions and taxes.
DVY vs SCHD, what each trust holds and how it is valued
Structure, in plain languageDVY · Dow Jones U.S. Select Dividend Index
DVY Tracks the Dow Jones U.S. Select Dividend Index, relatively high dividend yielding U.S. stocks. It was launched in Nov 3, 2003 and charges 0.38%. Index rules, risks and tax treatment are described in the prospectus and on the issuer page.
SCHD · Dow Jones U.S. Dividend 100 Index
SCHD Tracks the Dow Jones U.S. Dividend 100 Index, about 100 large U.S. companies chosen for dividend quality and sustainability. It was launched in Oct 20, 2011 and charges 0.06%. Index rules, risks and tax treatment are described in the prospectus and on the issuer page.
Custody, valuation and fee terms sit in each prospectus; read them before relying on this summary.
DVY vs SCHD, why yield and returns differ
The fee explains most of the gapDVY is built around high dividend yield and SCHD around dividend quality, so they own different stocks and weight sectors differently. Both track an index and pay quarterly distributions.
Dividend ETFs differ mainly in how the index picks stocks: by current yield, by dividend quality or by dividend growth. That choice drives the sector mix and the yield you receive, which is why the sector weights and the comparison with each fund’s own index matter more than any single yield figure.
How to decide between DVY and SCHD
A step-by-step frameworkStart with what separates them: DVY is built around high dividend yield and SCHD around dividend quality, so they own different stocks and weight sectors differently. Both track an index and pay quarterly distributions.
- Step 1 · Market: DVY follows high dividend yield and SCHD follows dividend quality, so decide which exposure you want to own.
- Step 2 · Cost: DVY 0.38% vs SCHD 0.06%, or $38 vs $6 a year per $10,000.
- Step 3 · Yield and total return: compare the trailing yield with the NAV return, not the yield alone.
- Step 4 · What you own: check whether you already hold these stocks through another fund with the Diversification Calculator.
Size the position against your whole portfolio. Dividend funds can lag growth-led rallies and still fall in selloffs, so they usually play a defined role.
DVY vs SCHD for Canadian investors
Currency and account typeDVY and SCHD are U.S.-listed and trade in U.S. dollars, so buying them from a Canadian account usually involves converting Canadian dollars, which adds a cost on entry and exit. A move in the U.S. dollar also changes your return in Canadian dollars.
Quarterly distributions from U.S. funds can face U.S. withholding tax depending on the account type, and the split between income types varies. Confirm the rules for your account with a tax professional. This is general education, not tax advice.
Risks of DVY and SCHD
What can go wrongShared risks
- Both funds hold stocks, so they can fall with the market and have fallen sharply in past selloffs.
- Dividends are not guaranteed and companies can cut what they pay.
- A high yield can signal that a stock has fallen or that a dividend is at risk, so yield alone does not show quality.
- Sector concentration can make a dividend fund move differently from the broad market.
Fund-specific risks
- DVY: Tracks the Dow Jones U.S. Select Dividend Index, relatively high dividend yielding U.S. stocks.
- SCHD: Tracks the Dow Jones U.S. Dividend 100 Index, about 100 large U.S. companies chosen for dividend quality and sustainability.
- DVY: expense ratio 0.38%, net assets $23.68B. SCHD: expense ratio 0.06%, net assets $119.9B.
- Both: see each prospectus for index methodology, concentration and tax disclosures.
DVY vs SCHD taxes and account placement
General education, not tax adviceDistributions from dividend funds can include qualified dividends, ordinary dividends and sometimes return of capital, and the mix changes from year to year. Whether a dividend is qualified depends on the stock and on how long you held the fund shares. Each issuer publishes a tax breakdown after year end, which is the figure to use.
For Canadian account types, see the Canadian section above. Confirm the rules for your account with a tax professional, and read how to build an ETF portfolio. This is general education, not tax advice.
Other ETFs people compare
For context, not recommendationsInvestors comparing DVY and SCHD often also look at the other funds in this group: DVY, SPYD, SCHD, VYM, HDV and VIG. See the high-yield dividend ETF comparisons, the dividend ETFs and the ETF research hub.
DVY vs SCHD drawdown arithmetic
What a decline means in dollarsRecovery gain = decline ÷ (1 − decline). The scenarios use illustrative declines of 10%, 20% and 30% so you can see what a drop does to each fund. Dividend funds hold stocks, so they can fall alongside the market. They are not a worst-case figure. See the Position Size Calculator.
Tools to compare DVY vs SCHD
Static weights from this pageIgnores taxes, spreads and holdings differences. ETF Fee Calculator.
Check shared exposure with the Diversification Calculator.
DVY vs SCHD, which fits which job
Characteristics, not recommendationsDVY may suit investors who want…
High current yield from a screened U.S. dividend index, at a higher fee.
Strengths
- Led in 2 of 3 return windows (to Sep 30, 2026)
- Quarterly dividend income
- Exchange-traded and priced all day
Watch points
- Higher fee: 0.38% against 0.06%
- Smaller fund: $23.68B against $119.9B
- Can fall with the market
- Dividends can change
SCHD may suit investors who want…
Dividend quality in a large, low-cost fund.
Strengths
- Lower fee: 0.06% against 0.38%
- Larger fund: $119.9B against $23.68B
- Quarterly dividend income
- Exchange-traded and priced all day
Watch points
- Led in 1 of 3 return windows (to Sep 30, 2026)
- Can fall with the market
- Dividends can change
DVY vs SCHD investor scenarios
Characteristics that fit, not recommendationsDVY vs SCHD key terms
Plain-language definitions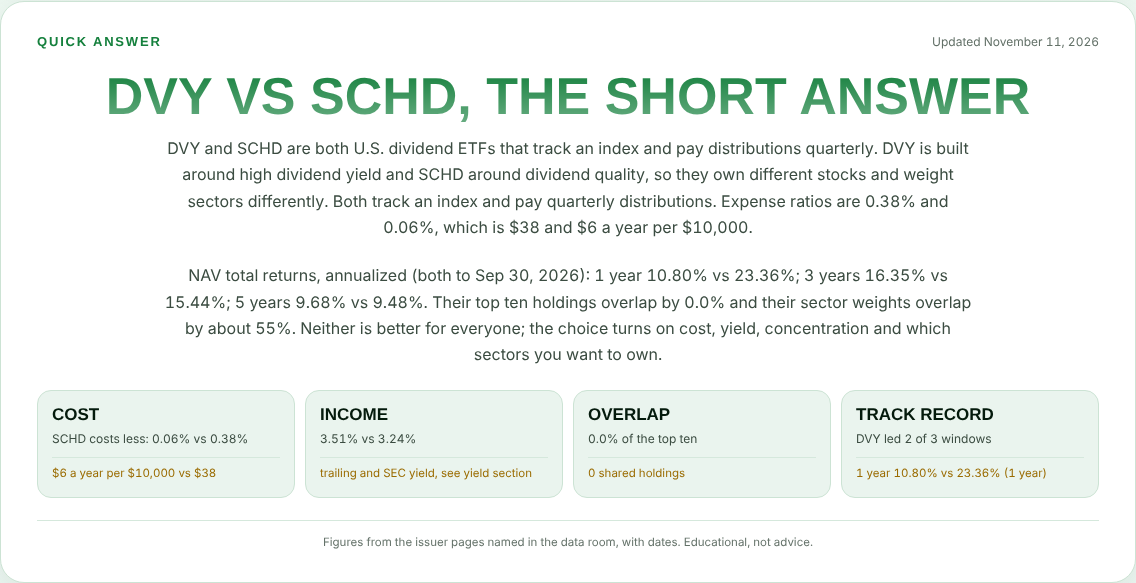
DVY vs SCHD, frequently asked questions
Answers use the figures and dates shown aboveIs DVY or SCHD better?
In the DVY vs SCHD question, neither is better for everyone. DVY and SCHD are both U.S. dividend ETFs that track an index and pay distributions quarterly. DVY is built around high dividend yield and SCHD around dividend quality, so they own different stocks and weight sectors differently. Both track an index and pay quarterly distributions.
Expense ratios are 0.38% and 0.06%, which is $38 and $6 a year per $10,000. NAV total returns, annualized (both to Sep 30, 2026): 1 year 10.80% vs 23.36%; 3 years 16.35% vs 15.44%; 5 years 9.68% vs 9.48%. Their top ten holdings overlap by 0.0% and their sector weights overlap by about 55%. Neither is better for everyone; the choice turns on cost, yield, concentration and which sectors you want to own.
DVY vs SCHD, what are the expense ratios?
DVY charges 0.38% and SCHD charges 0.06%, which is $38 and $6 a year per $10,000.
DVY vs SCHD, how much do the funds overlap?
On DVY vs SCHD, the top ten holdings overlap by 0.0% on the issuer data, with 0 shared names. This counts only the ten largest holdings of each fund, so the full portfolio overlap may differ.
DVY vs SCHD, what does each ETF hold?
DVY Tracks the Dow Jones U.S. Select Dividend Index, relatively high dividend yielding U.S. stocks. SCHD Tracks the Dow Jones U.S. Dividend 100 Index, about 100 large U.S. companies chosen for dividend quality and sustainability.
DVY vs SCHD, which has performed better?
NAV total returns, annualized (both to Sep 30, 2026): 1 year 10.80% vs 23.36%; 3 years 16.35% vs 15.44%; 5 years 9.68% vs 9.48%. Past performance does not guarantee future results.
DVY vs SCHD, which pays more income?
DVY reports 3.51% (Sep 30, 2026) and SCHD reports 3.24% (Sep 30, 2026). The measures are defined differently, so compare them with the NAV return before choosing.
DVY vs SCHD, can I own both?
On DVY vs SCHD, you can. Both hold U.S. dividend stocks, so owning both adds a second fee, and shared holdings repeat the same stocks (top-10 overlap 0.0%, sector overlap about 55%).
DVY vs SCHD, do the funds pay dividends?
On DVY vs SCHD, both pay distributions quarterly, funded by the dividends of the stocks they hold. The amount changes when companies change what they pay.
DVY vs SCHD, how are distributions taxed?
On DVY vs SCHD, distributions can include ordinary income, dividends, capital gains and return of capital, and the mix changes each year. Each issuer publishes a year-end tax breakdown. Confirm with a tax professional. This is general education, not tax advice.
DVY vs SCHD, are they suitable for Canadian investors?
On DVY vs SCHD, both are U.S.-listed and trade in U.S. dollars, so Canadians face currency conversion costs, and withholding tax on distributions depends on the account. Confirm with a tax professional. This is general education, not tax advice.
DVY vs SCHD documents and sources
Open the issuer documents before relying on any figureDVY · BlackRock (iShares)
SCHD · Schwab Asset Management
Third-party sources
BlackRock (iShares) DVY fund page · Schwab Asset Management SCHD fund page.
Methodology and limits
- DVY figures come from the BlackRock (iShares) fund page and SCHD figures from the Schwab Asset Management fund page.
- Dates are shown beside each figure; the issuer documents are linked below.
- Overlap is the sum of the smaller weight of each shared holding among the ten largest holdings published for each fund.
- Comparison index returns come from the issuer page; funds without one on the page are left out of the table.
- Figures an issuer page does not show are marked Not captured, and nothing was filled from memory or from another fund.
- Returns are dated Sep 30, 2026 for both funds on this page. Growth of $10,000 is derived from annualized NAV total returns; dollar values are approximate.
Educational research, not personalized investment, tax or legal advice, and not a recommendation to buy or sell any fund. Investing involves risk, including loss of principal. Past performance does not guarantee future results. Calculators are hypothetical illustrations. Fund data are provided as published by the sources named and may differ from current figures.