ETF Creation and Redemption: How Shares Are Priced and Traded
Follow the assets, shares and cash behind ETF transactions. Understand authorized participants, NAV, premiums and discounts, and the costs of trading.
ETF creation and redemption explains how a fund adds or removes shares while ordinary investors trade on an exchange. These are connected activities, but they are not the same transaction. Buying 100 ETF shares through a broker does not necessarily send money into the fund or cause it to buy more securities.
The distinction matters when you compare market price with net asset value, interpret fund flows or estimate trading costs. A fund can have heavy exchange turnover with no change in shares outstanding. It can also trade below its reported NAV without offering a risk-free bargain.
This guide follows ETF shares from the underlying portfolio to the exchange. It uses hypothetical creation units, premium-and-discount examples, and two calculators to explain the mechanics. For an introduction to choosing and owning funds, start with our ETF beginner’s guide. Our broader explanation of how ETFs work provides the foundation; this article examines the primary-market process in detail.
ETF Creation and Redemption: The Essential Distinction
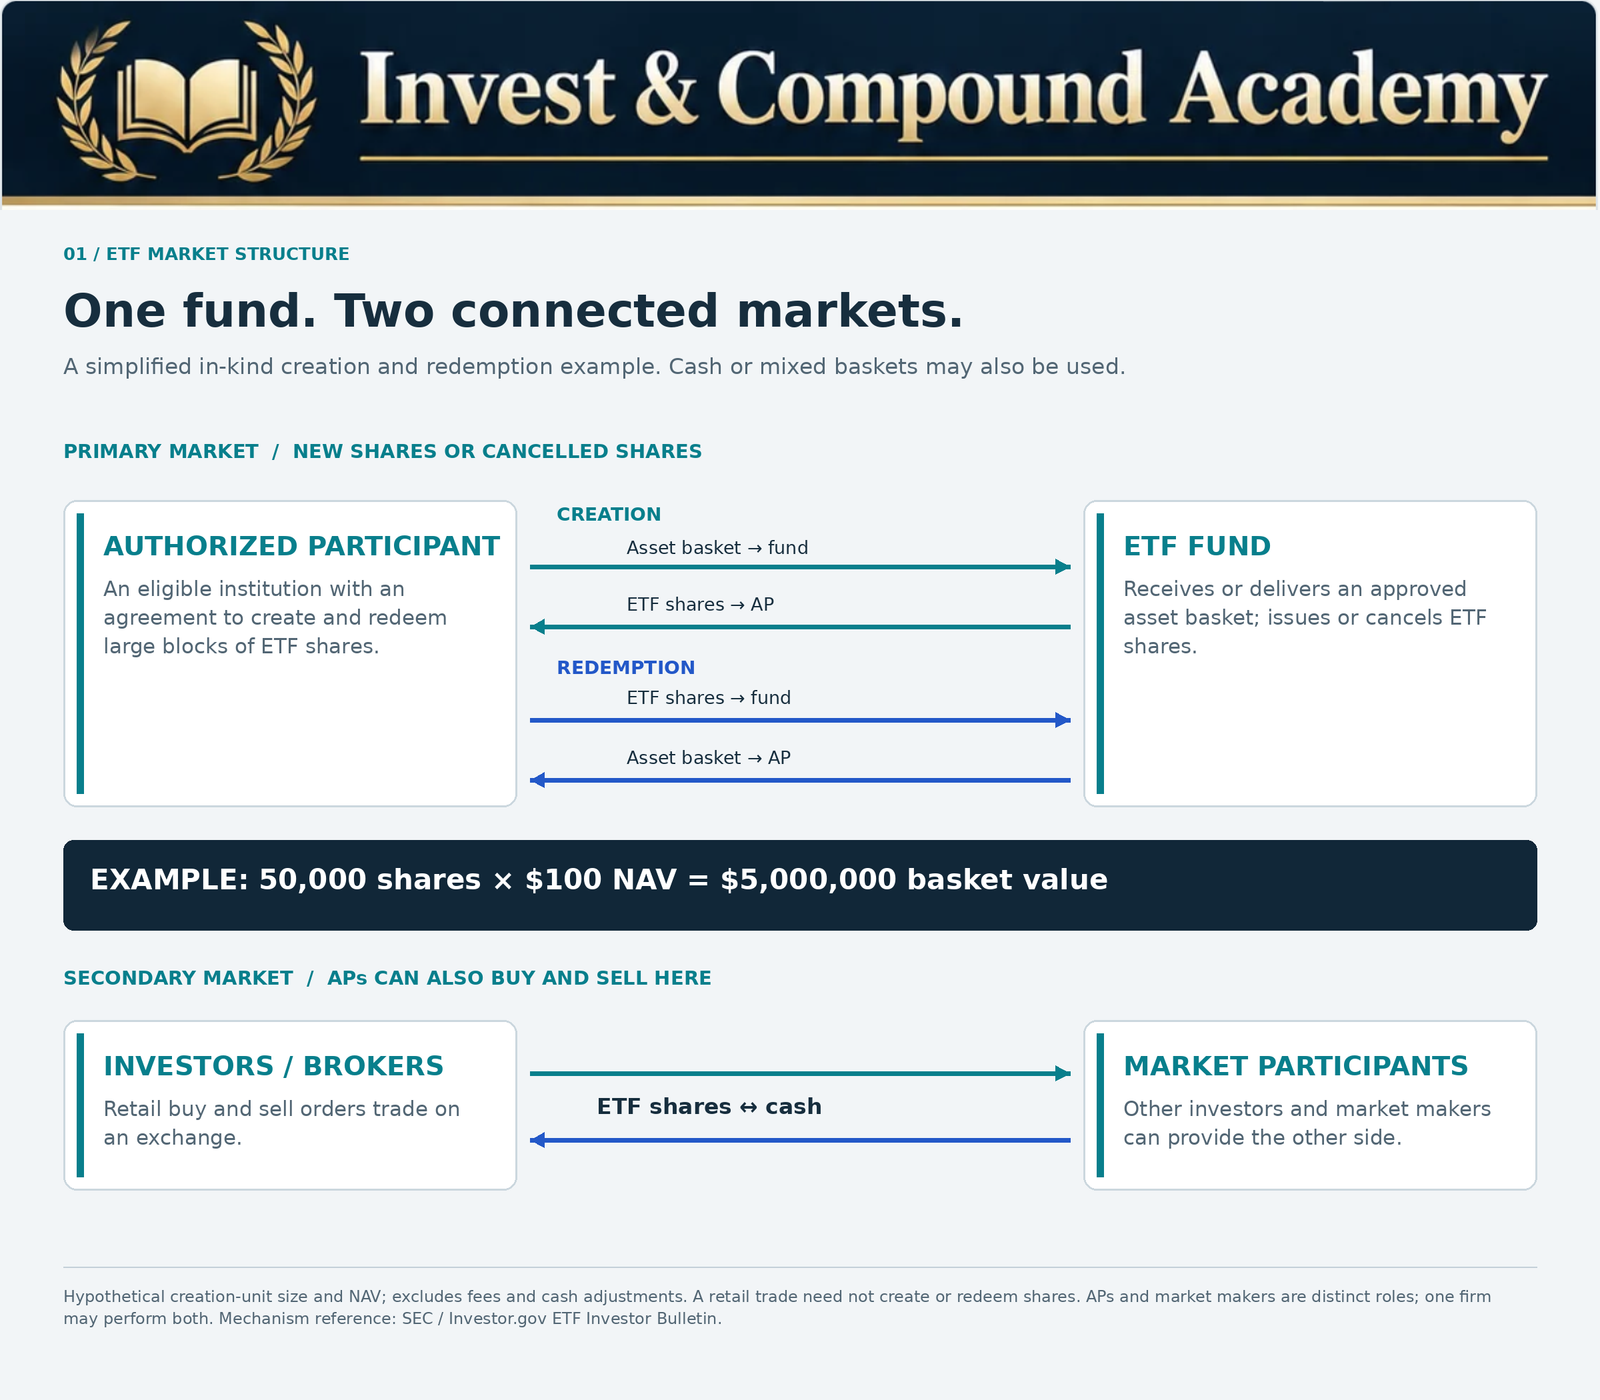
An authorized participant, or AP, can deliver an approved basket of securities, cash or both to the fund in exchange for a large block of newly issued shares. Redemption reverses the transaction: the AP delivers fund shares and receives the specified redemption consideration. The redeemed shares are cancelled.
Most individual investors use neither process directly. They trade ETF shares through a broker at an exchange market price. Their counterparty might be another investor or a market maker. A financial institution may perform multiple roles, but trading shares and creating them remain different functions.
The discussion primarily describes U.S. registered investment-company ETFs. Product documents and local rules determine the details. Commodity trusts and exchange-traded notes can have materially different ownership, operational and tax arrangements.
What an ETF Investor Actually Owns
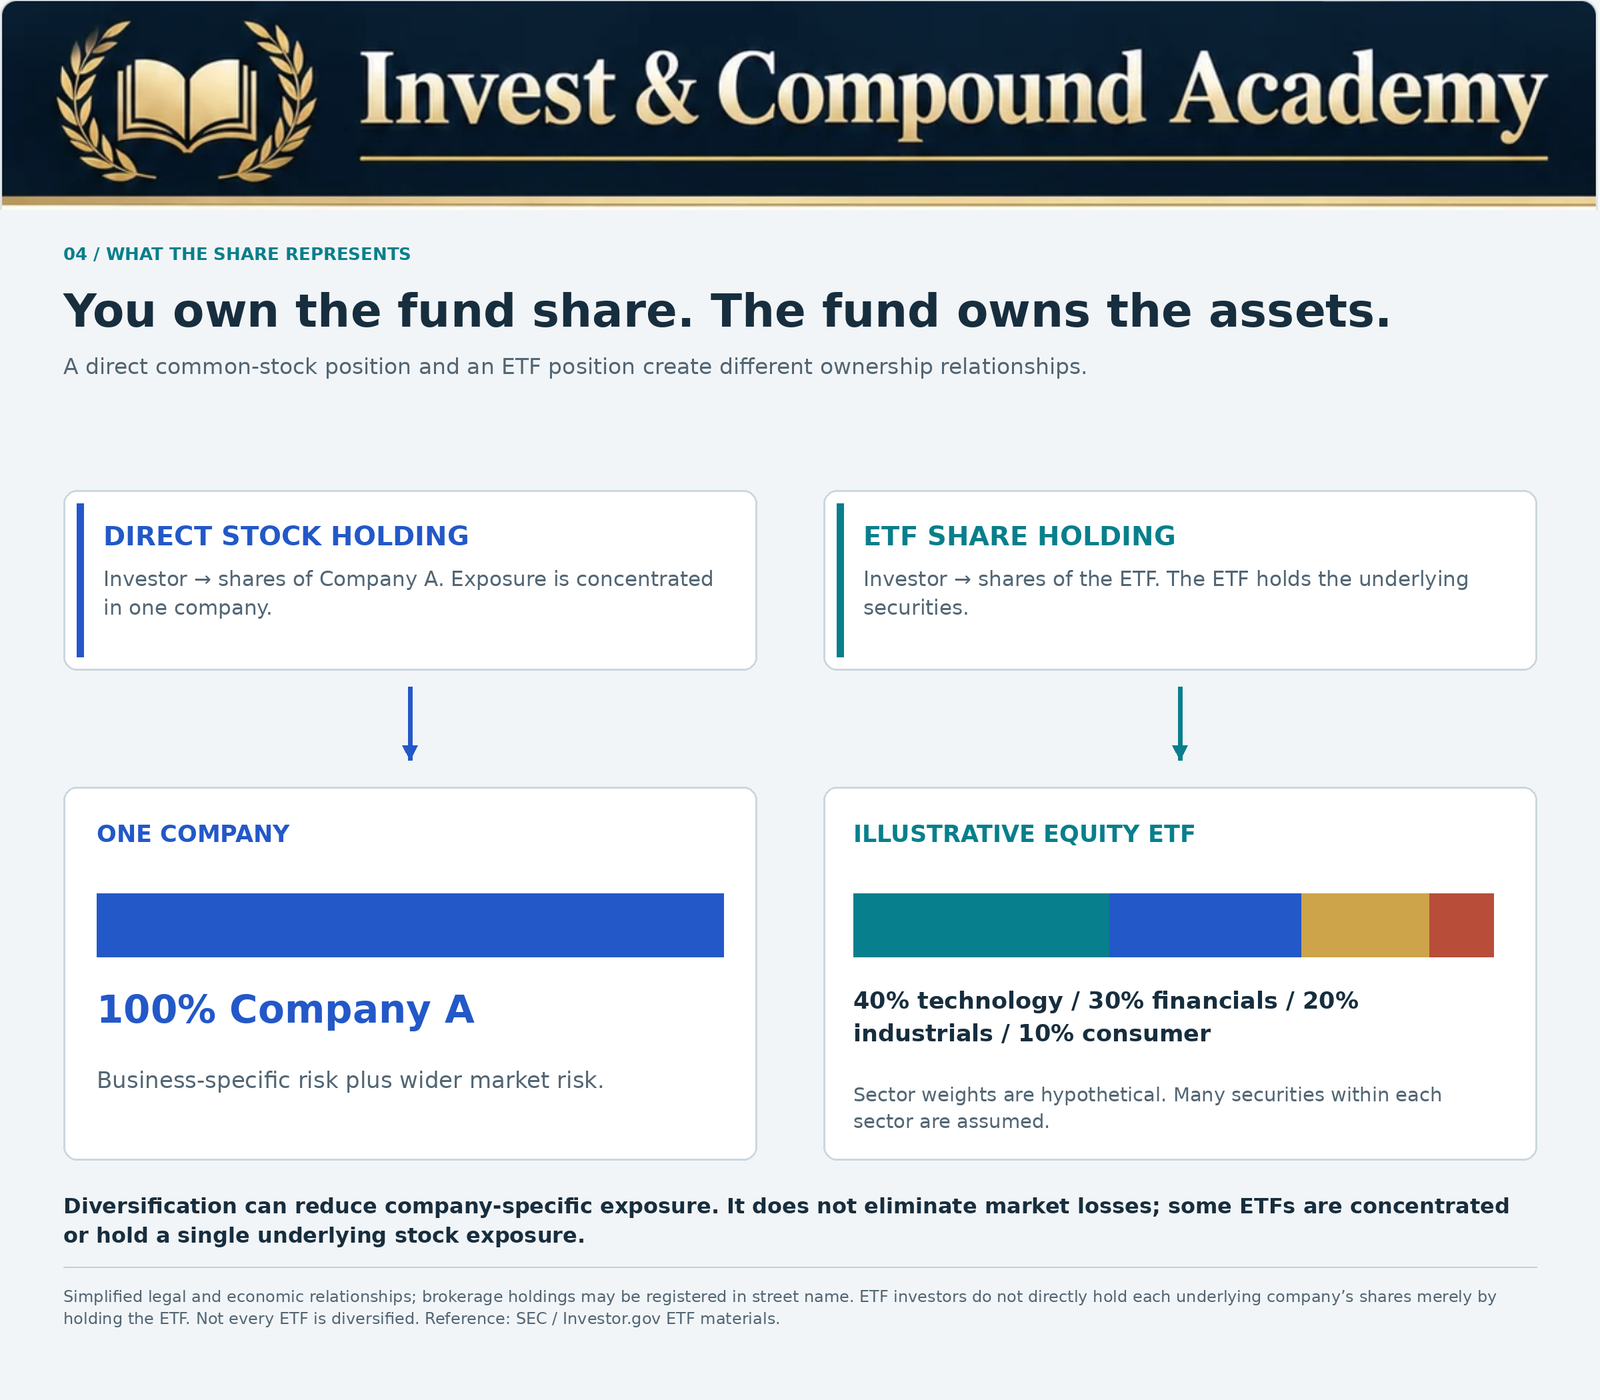
An ETF investor owns shares of the fund. The fund owns or obtains exposure to its underlying investments. Holding the ETF does not ordinarily make you the direct shareholder of every company in its portfolio.
Suppose a hypothetical fund has $100 million in assets, no liabilities and one million shares outstanding. Its NAV is $100 per share. An investor holding 100 shares has an economic interest corresponding to $10,000 of net fund assets at that valuation; the exchange price of those shares can differ.
Imagine the portfolio allocates 40% to technology, 30% to financials, 20% to industrials and 10% to consumer businesses. Those are illustrative sector weights, with multiple holdings assumed within each sector. They do not establish that the fund is adequately diversified for every purpose.
The ownership distinction helps explain both pooled exposure and the limits of shareholder rights. Our ETF versus stock guide develops that comparison. The construction of an actual benchmark matters too: see how the S&P 500 works.
Primary and Secondary Markets in ETF Creation and Redemption
| Feature | Secondary market | Primary market |
|---|---|---|
| Typical participants | Investors, brokers and market makers | The ETF and authorized participants |
| What changes hands? | ETF shares and cash | Creation-unit shares and approved securities, cash or both |
| Does the transaction change shares outstanding? | Not by itself | Creation increases them; redemption reduces them |
| Relevant price | Negotiated exchange execution price | NAV-based transaction terms, adjustments and fees under fund procedures |
| Typical retail access | Through a brokerage account | Generally unavailable directly |
Consider an investor buying 200 existing shares from a seller. The buyer’s cash goes to the seller, through the trading and settlement system. The fund need not receive any of that cash. If the seller is a market maker, it may use existing inventory rather than arrange a new creation immediately.
A subsequent creation could replenish inventory, meet client demand or support another transaction. It need not match the size or timing of a particular retail trade. This is why exchange trading volume should not be treated as a direct measure of subscriptions into the portfolio.
Unlike ETF exchange transactions, traditional mutual-fund purchases and redemptions generally transact at the next applicable calculated NAV, subject to fund terms and charges. The ETF versus mutual fund guide explains the practical differences without assuming one format is always preferable.
Authorized Participants in ETF Creation and Redemption
An authorized participant is an eligible financial institution with a contractual arrangement allowing it to place creation and redemption orders. A market maker provides bid and ask quotations for exchange trading. One firm may do both, but neither term is a synonym for the other.
An AP can act for its own account or facilitate transactions for clients and other market participants. It must follow the fund’s procedures, including order deadlines, basket requirements, settlement arrangements and applicable transaction charges. It cannot simply demand any securities it wants in exchange for any number of shares.
AP relationships create access to the primary market; they do not oblige every institution to commit unlimited capital in all conditions. Financing costs, hedging difficulty and market risk influence whether a proposed transaction is attractive.
The purpose of ETF creation and redemption is therefore easier to understand as an operating mechanism with economic incentives. It is not an insurance policy against bad executions, falling portfolios or temporary pricing gaps.
ETF Creation and Redemption Baskets: A $5 Million Example
A creation unit is a block of ETF shares used for primary-market transactions. Its size is specified by the fund and can vary considerably across products. The 50,000-share quantity below is hypothetical, not an industry-wide requirement.
Assume one creation unit contains 50,000 shares and NAV is $100 per share. The unit represents $5 million of net assets. In a simplified in-kind creation, the AP delivers an approved basket worth $5 million and receives 50,000 shares. Actual transactions may include a cash balancing amount, fees and other adjustments.
A basket need not be an exact miniature of every portfolio holding. Eligible funds can use custom baskets under their governing procedures. The SEC’s ETF rule includes conditions for such arrangements. This flexibility is particularly relevant when replicating every holding would be difficult or unnecessarily expensive.
An ETF’s strategy also affects implementation. Full replication holds benchmark constituents; sampling uses selected holdings intended to approximate the benchmark. Derivative-based exposure can involve collateral, counterparties and financing. The prospectus explains which approach the fund uses, while the creation basket describes what is accepted for a particular primary-market transaction.
How ETF Share Creation Works
The sequence below is a simplified operational example. Order submission, valuation and settlement timing depend on the fund and market infrastructure.
- The fund makes the relevant basket information and transaction requirements available through its procedures.
- An AP obtains the required securities or arranges permitted cash consideration.
- The AP submits an accepted creation order and fulfills settlement obligations.
- The fund receives the consideration and issues the creation-unit shares.
- The AP holds, transfers or sells the ETF shares, including through the secondary market.
New issuance does not automatically dilute existing shareholders. Suppose a fund begins with $100 million of net assets and one million shares: NAV is $100. A correctly valued $5 million creation adds 50,000 shares. Net assets become $105 million and shares become 1.05 million, leaving NAV at $100 before transaction effects.
That arithmetic assumes fair valuation and appropriate allocation of costs. It does not mean every creation is costless. Basket trading, cash transactions and imperfect cost recovery can affect the fund or participants.
ETF creation and redemption lets share supply respond to demand. It does not mean increased demand must permanently raise the ETF’s price above the value of an unchanged portfolio.
How ETF Share Redemption Works
In a redemption, an AP assembles the required number of shares and submits an order under the fund’s procedures. It delivers the shares, receives the specified securities, cash or combination, and the shares are removed from circulation.
Reverse the previous example: a fund with $105 million of net assets and 1.05 million shares redeems 50,000 shares for $5 million of assets. It returns to $100 million and one million shares. NAV remains $100 before costs and market changes.
A retail sale is different. Selling 100 shares on an exchange does not entitle the seller to a proportional delivery of the fund’s underlying holdings. The seller receives the trade proceeds from the counterparty, subject to the account’s trading and settlement arrangements.
During a selloff, many shares may change hands without immediate primary-market redemptions. Redemptions can occur if market participants find them economically useful. The mechanism changes how transactions are handled; it does not prevent the underlying holdings from losing value.
NAV, Market Price and Valuation Timing
For example, $250 million of assets minus $1 million of liabilities gives $249 million in net assets. Dividing by five million shares gives NAV of $49.80. Liabilities can include accrued expenses and other obligations; gross asset value alone is not NAV.
U.S. registered ETFs calculate official NAV each business day. Exchange prices move throughout the session. A live quote compared with yesterday’s NAV combines two valuation times and may not measure a current premium accurately.
Official NAV is itself a calculated valuation under the fund’s policies. Securities that have not traded recently may require valuation estimates. Funds holding foreign securities can face different trading hours and fair-value adjustments. Always read the issuer’s methodology before interpreting a displayed gap.
This article concerns share pricing and fund transactions. For accounting analysis of an income strategy, see how to read covered-call ETF financial reports. A premium or discount to NAV is different from a decline in NAV caused by the fund’s investment results and distributions.
ETF Premiums and Discounts: The $50 NAV Example
| NAV per share | Market price | Dollar difference | Premium or discount |
|---|---|---|---|
| $50.00 | $50.25 | +$0.25 | +0.50% premium |
| $50.00 | $50.00 | $0.00 | 0.00% |
| $50.00 | $49.75 | −$0.25 | −0.50% discount |
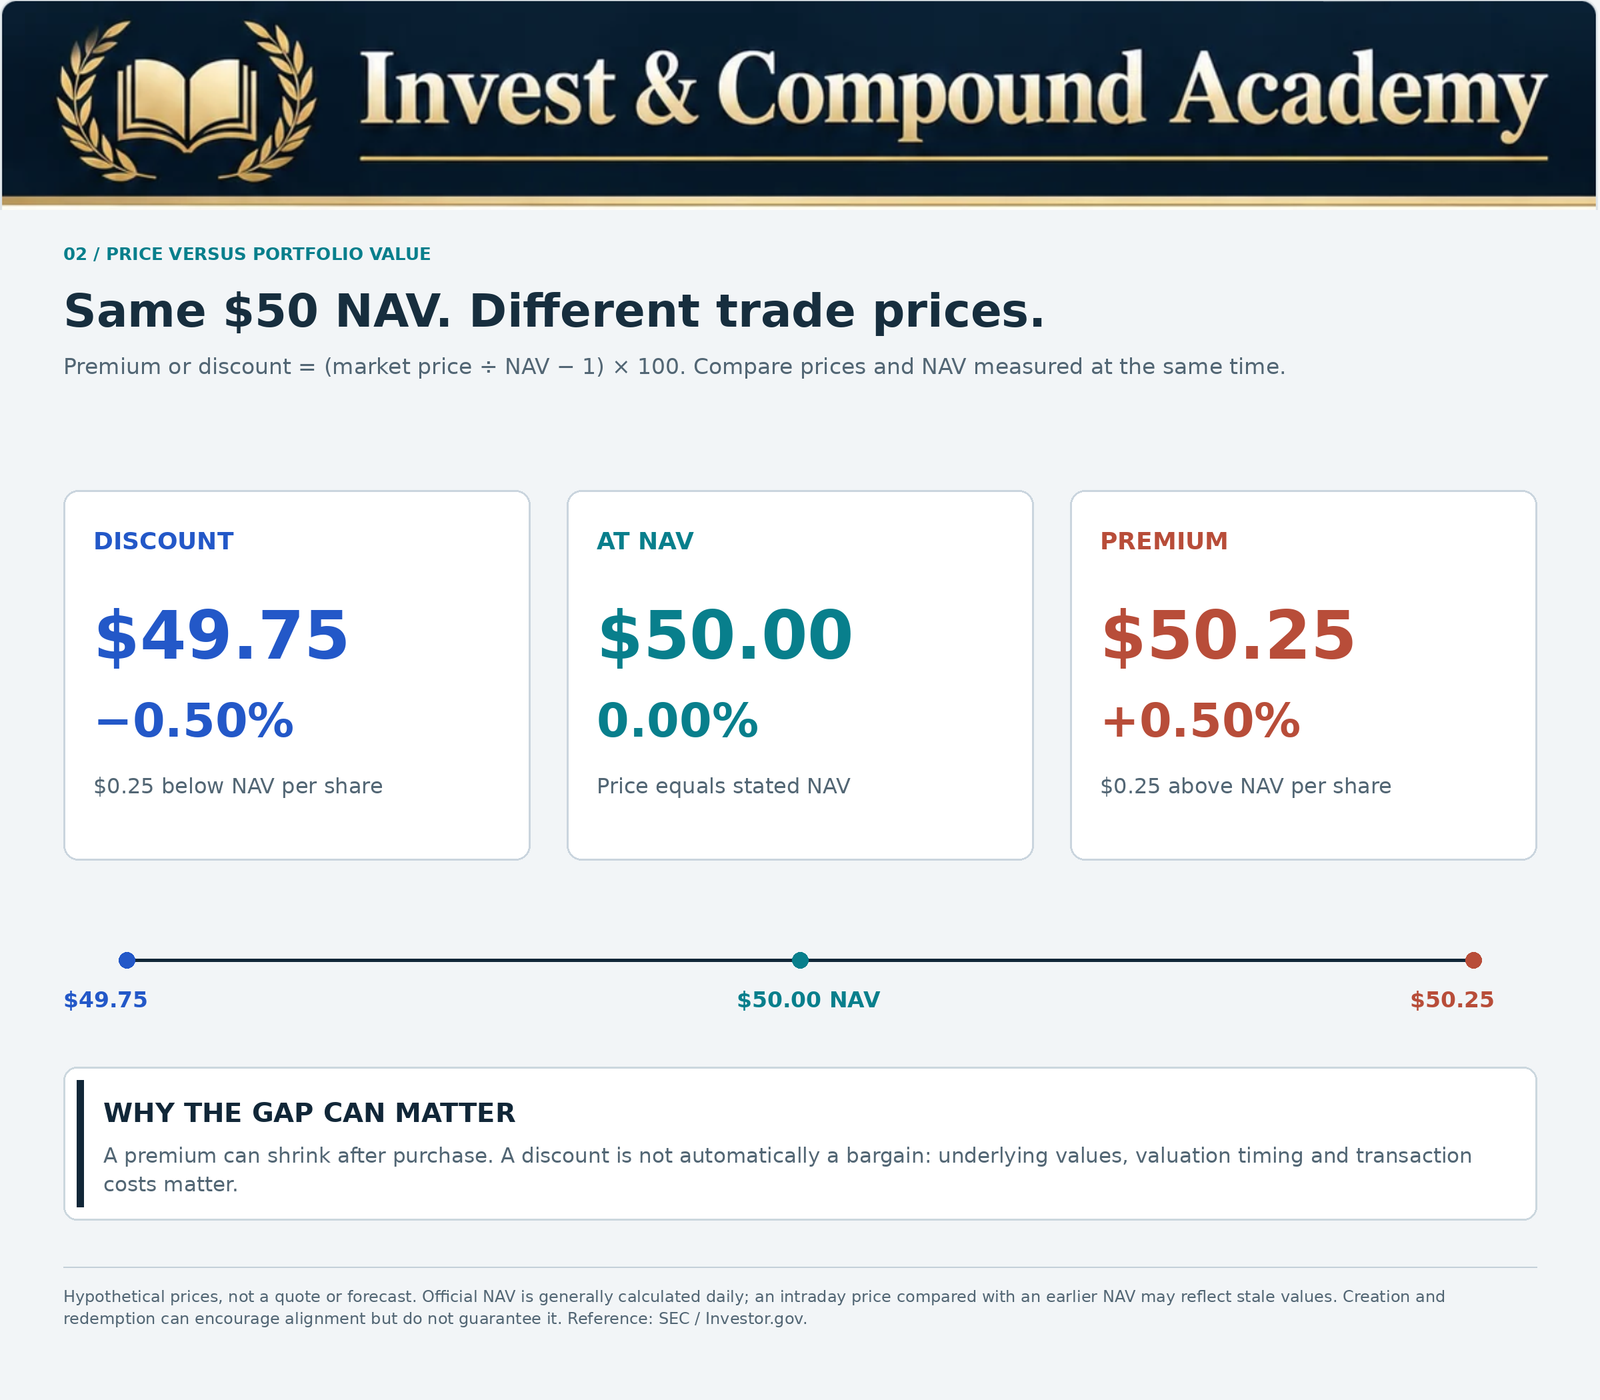
The percentage uses NAV as the denominator. It is not the bid-ask spread, which compares two exchange quotations. An ETF can have a tight spread while trading above its reported NAV, or a wide spread with its midpoint close to NAV.
A premium can affect investor returns even if NAV is stable. Buying 100 shares at $50.25 costs $5,025. If NAV stays $50 and the premium disappears, selling at $50 produces $5,000 before other costs: a $25 loss, or approximately 0.498% of the purchase price.
A discount is not a promise of profit. It may reflect stale underlying prices, difficult execution or changing expectations. ETF creation and redemption can encourage alignment, but the difference has to be economically tradable after all relevant costs.
Arbitrage Incentives: Gross Opportunity Is Not Net Profit
Suppose the relevant creation basket costs $5 million and 50,000 ETF shares can be sold for $100.50 each. The gross difference is $25,000. If the combined basket-trading, financing, hedging and transaction costs total $15,000, the simplified remaining difference is $10,000.
The example assumes those prices and quantities are executable, values do not change unfavorably, settlement is completed and all relevant costs have been identified. Real transactions can fail to meet those assumptions. Institutions may hedge exposures, face capital constraints or decline the transaction entirely.
At a discount, the direction reverses. Buying 50,000 shares at $99.50 costs $4,975,000. Redeeming them for assets valued at $5 million presents the same $25,000 gross difference before costs and risks. The asset valuation does not guarantee that the full basket can immediately be sold for that amount.
Creation can increase available share supply; redemption can remove shares. Those incentives help link market prices and underlying values. They do not guarantee immediate convergence, continuous liquidity or a profitable strategy for retail investors.
Cash Versus In-Kind ETF Creation and Redemption
In an in-kind transaction, securities move between the AP and the fund. In a cash transaction, the fund receives or pays cash and may need to trade underlying assets. Mixed arrangements use both.
Cash transactions are not inherently defective. They may be necessary or practical for a particular market, asset or strategy. They can introduce fund-level trading activity, however, and associated costs need to be considered. Transaction charges and other arrangements may allocate some costs to the transacting participant.
In-kind redemptions can support tax efficiency for some U.S. funds by transferring securities rather than selling them for cash. That does not eliminate all realized gains, taxable distributions or investor-level taxes. Strategy, turnover and tax law remain relevant.
Canadian tax treatment, foreign withholding and registered-account rules require separate analysis. A U.S. structural explanation does not establish a Canadian investor’s tax outcome. The broader ETF and mutual-fund comparison provides context, while a decision to change wrappers requires its own switching-cost assessment.
Liquidity Depends on More Than ETF Trading Volume
ETF liquidity has several layers: exchange quotations, available order size, the tradeability of the holdings and the ability to create or redeem shares efficiently. Daily share volume describes past turnover, not the full cost of a proposed transaction.
An ETF holding liquid securities may support transactions through market makers and APs even when its own historical volume is modest. Conversely, high exchange volume does not make illiquid underlying holdings easy to sell at an unchanged price.
Order size matters. A displayed ask may cover only a small number of shares. A larger market order can consume several price levels and execute at an average price above the initial quote. A screen showing a narrow spread is therefore not proof that a large trade will have negligible market impact.
For practical research, inspect issuer disclosures, historical spreads and premium-and-discount data alongside holdings and strategy. Our ETF research guide explains which documents to gather before reaching a conclusion.
ETF Creation and Redemption During Market Stress
Volatility can increase the cost of hedging, widen underlying spreads and make basket prices less certain. An AP may require a larger potential margin before committing capital. Market makers may quote less size or wider spreads.
A bond ETF’s exchange price and its reported NAV can also reflect different valuation inputs. An international ETF can keep trading while some underlying exchanges are closed. These are reasons to investigate a pricing gap; they are not reasons to assume NAV is always wrong or market price is always right.
To connect these mechanics with market conditions, begin with what a market correction means and the difference between a correction and a bear market. Our bear-market guide examines broader losses, while market warning signs explains vulnerability indicators without treating them as forecasts.
Time matters too. Correction duration and bear-market recovery periods measure investment paths, not the lifespan of an individual pricing discrepancy. ETF creation and redemption does not impose a recovery deadline on a falling portfolio.
Bid-Ask Spreads: A Worked Trading-Cost Example
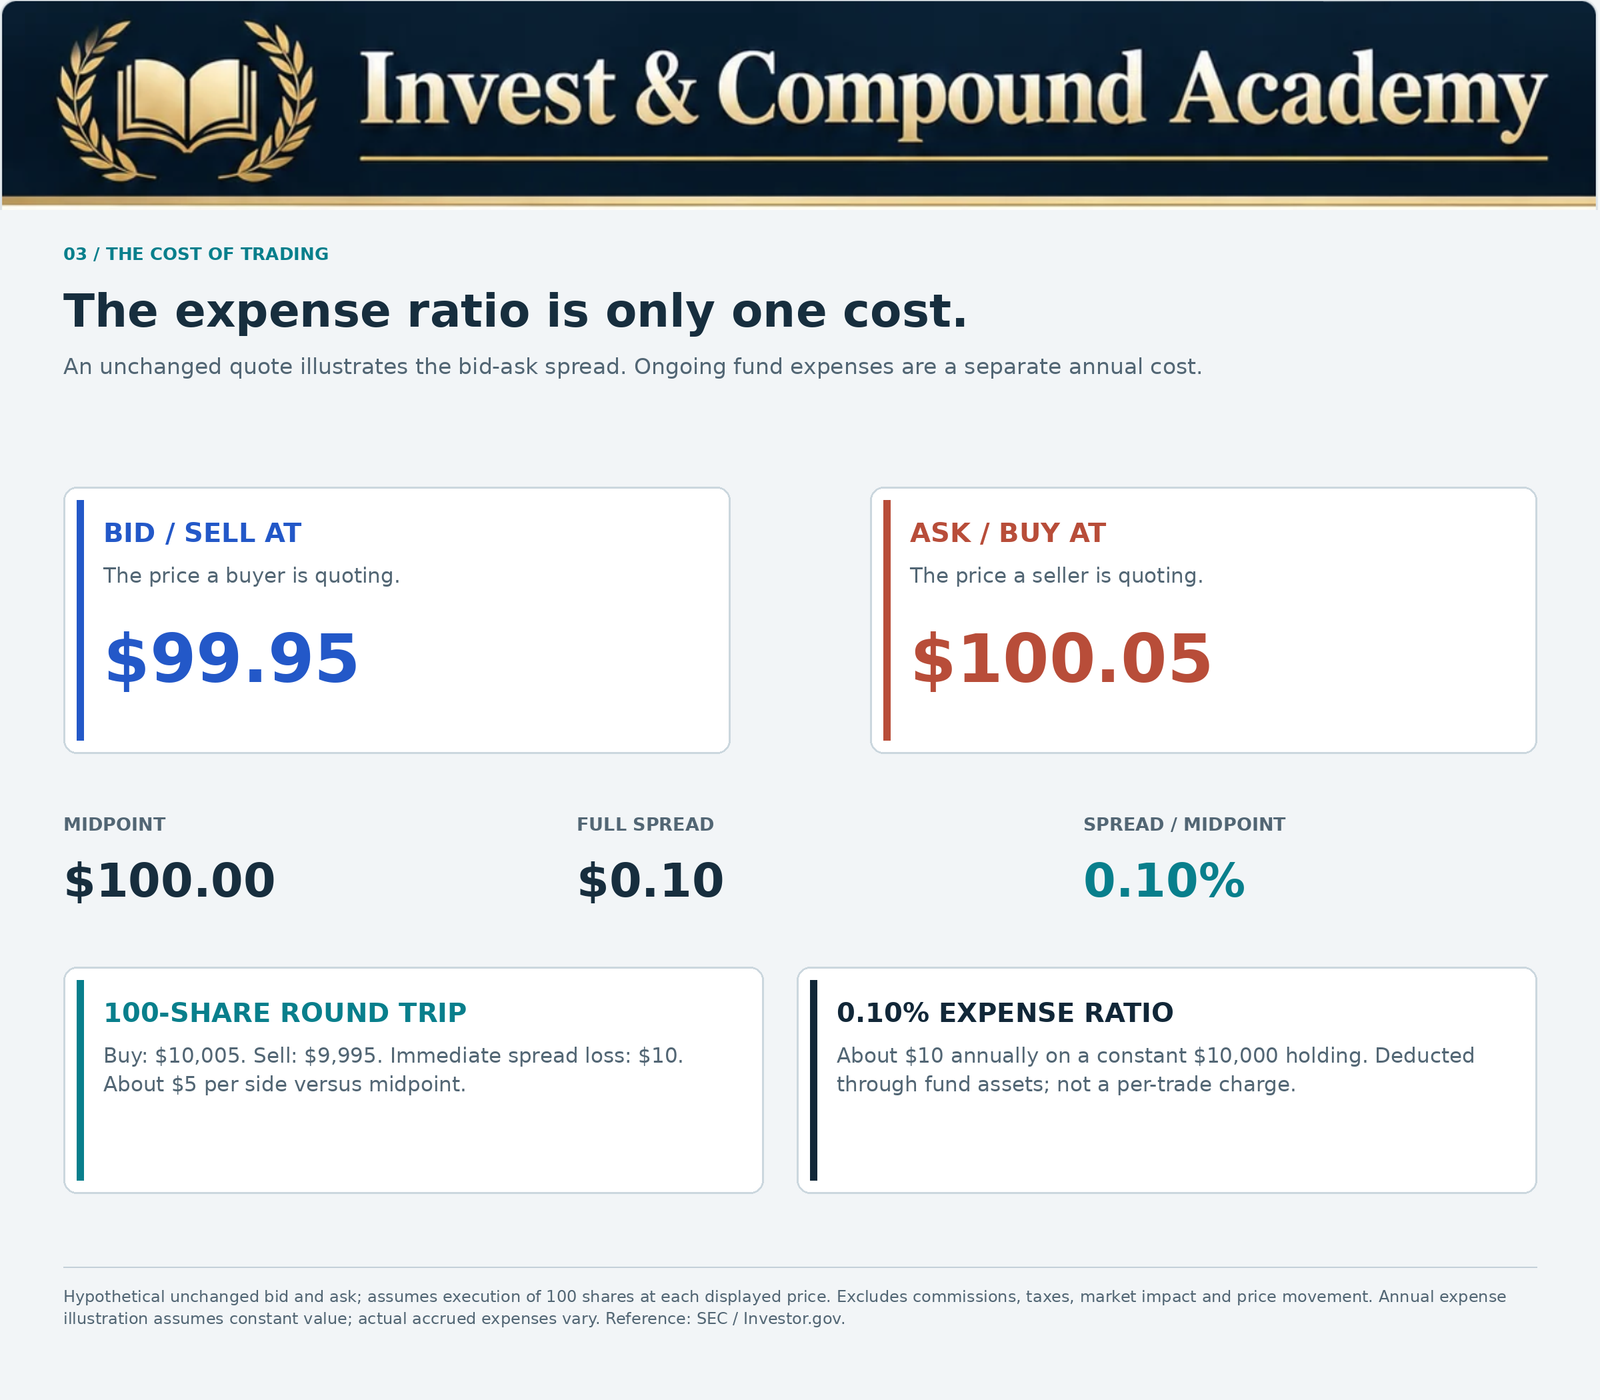
Assume an ETF is quoted at a $99.95 bid and $100.05 ask. The midpoint is $100 and the full spread is $0.10 per share.
The quoted spread is 0.10%. Buying 100 shares at the ask costs $10,005. Immediately selling 100 shares at the unchanged bid returns $9,995. The difference is $10 before commissions or other charges.
Measured against the midpoint, the hypothetical buyer pays $5 above $10,000, and the seller receives $5 less than $10,000. Those two $5 differences together equal the $10 round-trip spread cost. Do not count the full spread on both sides of the same unchanged-quote round trip.
The midpoint is a comparison benchmark, not a guaranteed executable fair value. Actual execution can improve on the quote or be worse because of size, movement and market impact. A spread calculation is an illustration, not an execution promise.
Expense Ratios and Trading Costs Measure Different Things
An annual expense ratio of 0.10% corresponds to approximately $10 on a constant $10,000 holding for a year. This is separate from the $10 round-trip spread cost in the example above. Fund expenses accrue through assets over time; they are not a charge applied each time you trade.
On a constant $50,000 holding, 0.10% and 0.75% imply approximately $50 and $375 in annual expenses, a $325 difference. Changing asset values, fee waivers and actual expense accrual affect the realized amounts.
Compare similar objectives before comparing prices. A broad index fund and a covered-call strategy do not become substitutes merely because both are ETFs. JEPI, JEPQ, SPYI and QQQI illustrate why strategy research matters alongside the fee table.
A fee is one influence on the return an investor keeps. Our investment-growth measurement guide separates contributions from gains, while compound-interest mathematics shows why recurring differences matter over time.
Order Types and Execution Timing
A market order seeks execution against available liquidity without fixing a maximum purchase price or minimum sale price. A limit order sets a price boundary but may remain unfilled or fill only partially. Neither order type removes the risk of an unfavorable market move after the trade.
For an ETF holding foreign assets, consider whether the relevant underlying exchanges are open. Around major news and periods of disrupted liquidity, quoted prices and available size can change quickly. There is no universal clock-time rule that makes every ETF trade efficient.
Review the bid, ask, order quantity, limit and account currency before submitting an order. Brokerage commissions and foreign-exchange conversion can outweigh a small difference in fund expenses, particularly for a small purchase.
If you can buy only whole shares, the dollar target may not translate into an exact share quantity. Our whole-share ETF rebalancing guide explains rounding and residual cash without assuming fractional-share access.
ETF Creation and Redemption Calculator: NAV and Share Counts
Use the first calculator to examine a correctly valued in-kind creation or redemption. It computes the starting NAV, the value of the selected share block and the resulting net assets and shares outstanding. It also compares an entered exchange price with the starting NAV.
The default fund has $100 million of net assets and one million shares. A block of 50,000 shares corresponds to $5 million at $100 NAV. Both creation and redemption leave NAV unchanged in this simplified model because assets and shares move at the same per-share value.
This tool illustrates accounting relationships, not an order accepted by an actual fund. Real creation units, transaction fees, basket adjustments, valuation changes and settlement obligations must be obtained from the fund’s documents.
ETF Trading-Cost Calculator: Spread, Premium and Purchase Amount
The second calculator uses a bid, ask, NAV, share quantity and commission. It shows the full quoted spread, spread percentage, ask-price premium or discount, purchase outlay and an immediate unchanged-quote round-trip cost.
The ask-to-NAV result describes the entered hypothetical purchase price. It is not necessarily the fund’s published closing premium, which may use a different market-price convention. Comparing a live ask with an older NAV may be misleading.
For the round-trip estimate, commission is charged once on the purchase and once on the sale. The tool assumes the same share quantity can execute at each entered quote. It excludes taxes, currency conversion, market impact and price movement.
Tracking, Distributions and Fund Flows: Avoid Double Counting
ETF creation and redemption is not the same as index tracking. Tracking difference measures the fund’s return minus its benchmark return over the same period and on a consistent basis. A 9.85% fund total return against a 10.00% benchmark total return gives a −0.15-percentage-point difference, or −15 basis points.
Tracking error concerns variability in periodic return differences. It is not another name for the annual fee. Expenses, sampling, cash, tax effects, trading and securities lending can all influence tracking results. Active funds should be evaluated against their stated objectives, rather than automatically judged as failed index trackers.
Distributions also require separate treatment. All else equal, a $2 distribution removes $2 of assets per share from a fund. Receiving cash and retaining a share with fewer net assets is not an instant $2 increase in wealth. See dividend yield versus total return and dividend yield explained. Tax-classified return of capital does not by itself prove economic deterioration.
Reinvestment buys additional shares; it does not undo the distribution adjustment. Broker rules determine whether purchases can include fractional shares. For longer investment paths involving withdrawals, the return-sequence workbook explains why cash flows change outcomes.
Put Fund Mechanics in Portfolio Context
A mechanically efficient ETF can still be a poor fit for a portfolio. A narrow sector fund can be concentrated, a bond fund can lose value when yields rise, and a leveraged or inverse fund can have daily-reset effects that differ from a simple multiple of a long holding-period return. An exchange-traded note also carries issuer-credit exposure because it is a debt obligation.
Begin with the intended exposure, then inspect implementation, costs and portfolio fit. Building an ETF portfolio is a separate task from understanding fund plumbing. VOO and VTI overlap shows why several tickers can duplicate holdings; VOO versus QQQ illustrates different underlying exposures. The QQQ-to-QQQM switching analysis connects recurring fees with one-time trading costs.
Historical evidence also needs the right measurement. Our major correction history, correction-frequency guide and S&P 500 correction statistics describe market risk, rather than the probability that an ETF discount will close. An economic recession concerns broad economic activity; inflation and investing concerns purchasing power.
A written plan can connect these concepts to decisions. What to do during a correction and buying during a correction discuss liquidity needs and uncertainty. None of those decisions should rest on the belief that ETF creation and redemption protects principal.
Frequently Asked Questions
Does every ETF purchase cause a new share to be created?
No. An exchange purchase can transfer existing shares from a seller. Primary-market creations occur separately through authorized participants and the fund’s procedures.
Can I redeem one ETF share for the underlying stocks?
Retail investors generally sell their shares on an exchange. Primary-market redemptions ordinarily require AP access and creation-unit quantities. Read the product’s documents for its specific arrangements.
Are APs required to keep the market price equal to NAV?
No. ETF creation and redemption provides a mechanism and incentives for addressing pricing differences. Costs, market risk, capital constraints and settlement conditions can prevent immediate convergence.
Is creating ETF shares the same as diluting a company’s shareholders?
Not automatically. When the fund receives assets of appropriate value for new shares, assets and shares increase together. NAV can remain unchanged before transaction effects, as the creation calculator demonstrates.
Why can an ETF trade below NAV?
Possible reasons include supply and demand, underlying transaction costs, valuation timing and uncertainty about executable asset prices. A discount is not enough to establish a mispricing or a profitable trade.
Does a wide spread mean the fund’s assets are unsafe?
A spread concerns the cost of transacting at the quoted prices. It does not directly measure issuer solvency, valuation or the likelihood of future investment losses. Underlying liquidity can influence it, but those risks still require separate research.
What happens if an ETF closes?
A closure commonly involves selling or distributing assets and paying investors under disclosed procedures. It does not automatically mean the investment becomes worthless, but market losses, costs, taxes and the need to replace the exposure can matter.
What should I read before relying on a fund’s mechanics?
Review the prospectus, holdings and basket disclosures where available, financial reports, expense information, and the issuer’s NAV and premium-and-discount methodology. Check product-specific creation-unit sizes and transaction terms rather than assuming the examples here apply universally.
Key Takeaways
- ETF creation and redemption changes shares outstanding; an exchange trade alone does not.
- Fund shareholders own ETF shares. The fund holds or obtains exposure to the underlying assets.
- A correctly valued creation adds assets and shares together, so new issuance need not dilute NAV.
- NAV, market price, premium or discount, and bid-ask spread describe different quantities.
- APs and market makers perform different roles. Their participation does not guarantee continuous liquidity or equal prices.
- Compare execution costs with recurring expenses, and avoid counting a full round-trip spread twice.
- Fund mechanics support an investment strategy; they do not remove its market, credit, concentration or currency risks.
Explore the Earlier Academy Pillars
These thirteen earlier pillars connect ETF market mechanics with economic conditions, historical market risk and portfolio decisions.
Continue Learning in the Invest & Compound Academy
Move from ETF creation and redemption to product research, ownership comparisons and practical portfolio implementation.
ETF structure, trading and portfolio research
Market Correction Pillar | Indexes and Markets | Portfolio Construction
Sources and Further Reading
Reference review: October 18, 2026. The structural discussion primarily concerns U.S. registered investment-company ETFs. ICI is an industry association; Vanguard is an issuer. Product documents and applicable local rules govern a specific fund. All prices, baskets, creation-unit sizes and calculator defaults are hypothetical. No live quotations or investment forecasts are provided.
- SEC Investor.gov: Updated Investor Bulletin — Exchange-Traded Funds. Primary and secondary markets, valuation, spreads and investor research.
- SEC: Exchange-Traded Funds — Small Entity Compliance Guide. Rule 6c-11, portfolio disclosure and custom-basket conditions.
- Investment Company Institute: ETF Basics — The Creation and Redemption Process and Why It Matters. Industry explanation of baskets and arbitrage incentives.
- Investment Company Institute: ETF Basics and Structure FAQs. Creation units, authorized participants and fund operations.
- SEC Investor.gov: Mutual Fund and ETF Fees and Expenses — Investor Bulletin. Fund operating expenses and additional transaction costs.
- SEC staff statement: Risk Legend for Non-Transparent ETFs. Exceptions to daily portfolio transparency and related disclosure considerations.
- Vanguard Canada: How Premiums and Discounts Work. Issuer explanation of pricing conventions, trading hours and valuation timing.
This article provides general financial education, not personalized investment, legal or tax advice or a recommendation to buy, sell or hold a security. Numerical examples simplify fund operations and exclude the complexities stated alongside each example.
ETF creation and redemption, market making and diversification do not guarantee profits, equal market prices and NAV, or continuous liquidity. Funds and other exchange-traded products differ in legal structure, objectives and risks. Investments can lose principal permanently.
Account rules, currencies, fees, taxation and execution conditions affect investor outcomes. Past performance does not guarantee future results. Read current fund documents and consider qualified professional advice where appropriate.