PEG Ratio Explained: Growth Assumptions, Examples and Pitfalls
Learn the PEG ratio formula, compare growth forecasts, calculate sensitivity and understand why a low PEG does not guarantee a bargain.
Growth can make a high P/E more reasonable, but growth also provides investors with a powerful excuse to rationalize an expensive purchase. The PEG ratio puts the earnings multiple beside a growth assumption. Here we will examine that assumption as rigorously as the number itself, rather than repeating the familiar and unreliable “below one means cheap” slogan.
Here’s a puzzle. Two stocks both trade at a P/E ratio of 20. One is a bargain. The other is overpriced. Which is which?
The P/E ratio alone can’t tell you — and that’s exactly the problem the PEG ratio was invented to solve. It takes the price you’re paying and weighs it against the growth you’re getting for that price. This guide explains the formula, how to read the number, and the one input that makes or breaks the whole thing.
What Is the PEG Ratio?
PEG stands for price/earnings-to-growth. It’s the P/E ratio divided by the company’s earnings growth rate:
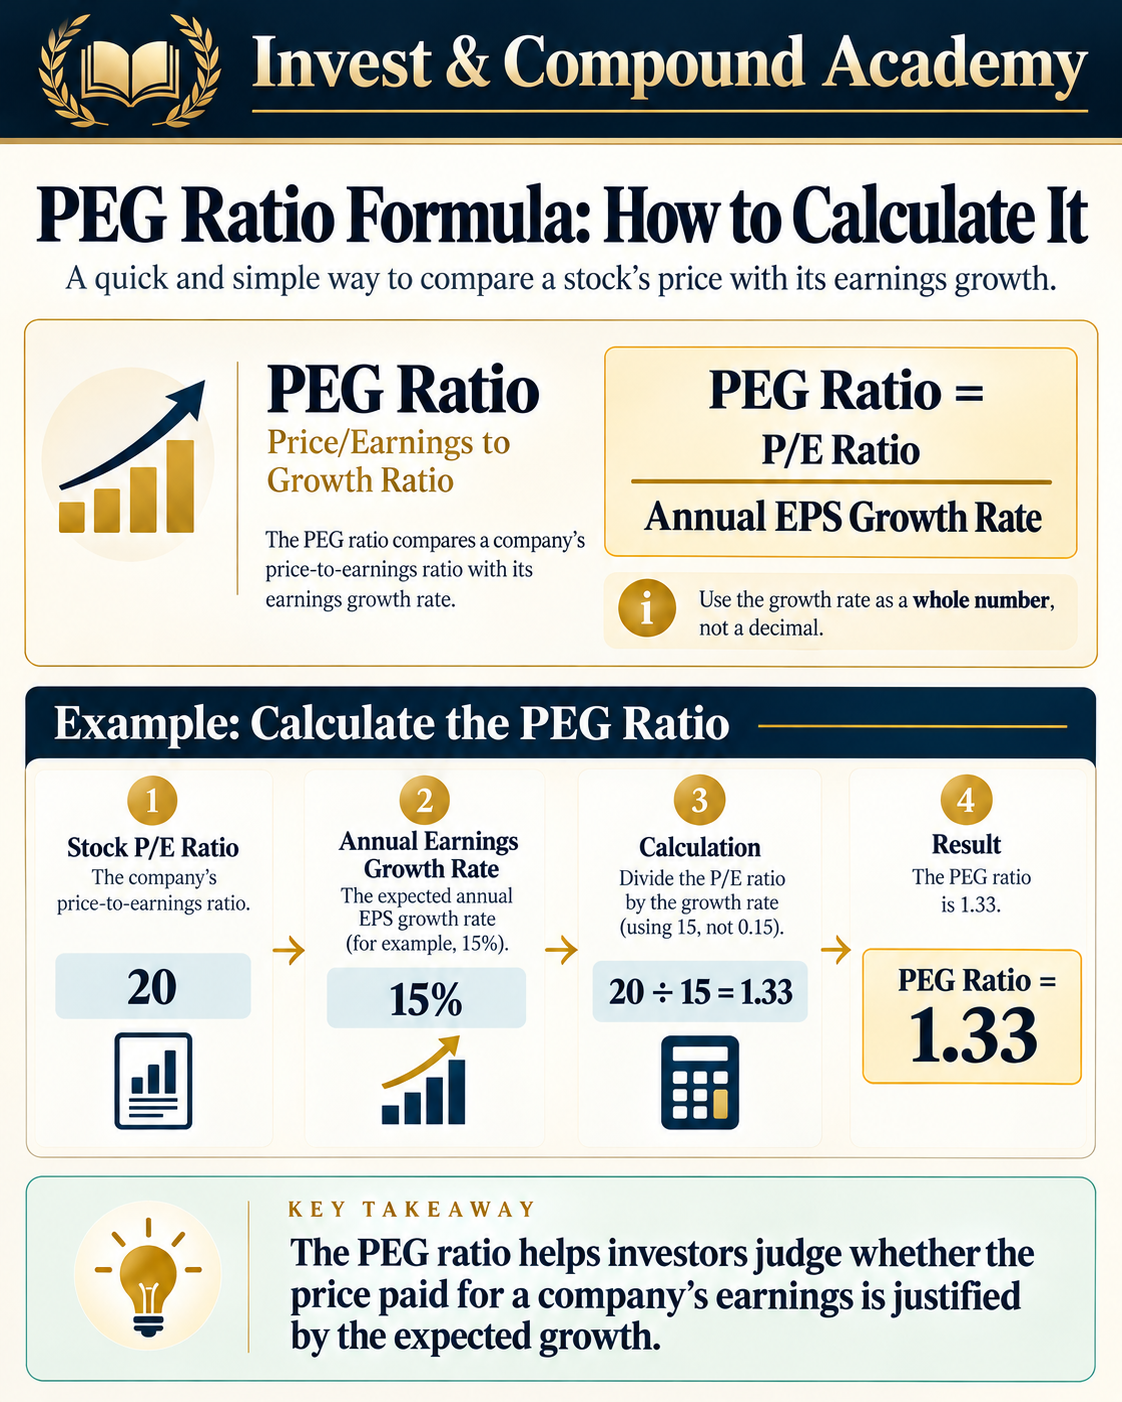
PEG ratio = P/E ratio ÷ annual earnings growth rate
The growth rate goes in as a whole number, not a decimal. So a stock with a P/E of 20 and earnings growing at 15% a year has a PEG of:
20 ÷ 15 = 1.33
In plain English: the PEG ratio shows how an earnings multiple compares with an assumed earnings-growth rate, without establishing fair value. A high P/E can look less demanding when expected earnings growth is high — and the PEG is the number that checks.
A Worked Example: Same P/E, Different Verdicts
This is where the PEG earns its keep. Take two companies, both trading at a P/E of 20:

Company A — Steady Eddie Industries
P/E ratio: 20
Earnings growing at 10% per year
PEG = 20 ÷ 10 = 2.0
Company B — Growth Rocket Inc.
P/E ratio: 20
Earnings growing at 25% per year
PEG = 20 ÷ 25 = 0.8
Same P/E, but dramatically different PEG figures. That is a useful clue, not a verdict. Company B has more growth in its forecast denominator, but the figure deserves scrutiny: is 25% growth sustainable, and what risk or dilution comes with it? Company A may have stronger cash generation or greater predictability. The PEG helps distinguish assumptions; it cannot choose the better investment on its own.
How to Read the Number: What Is a Good PEG Ratio?
The most quoted guide comes from Peter Lynch (more on him below), and it’s a rule of thumb — not a law of physics:

Below 1.0 — the earnings multiple is low relative to the assumed growth percentage; this can justify further research, not an undervaluation label.
Around 1.0 — the multiple and growth rate happen to be numerically similar under the convention; fair value is not established.
1.0 to 2.0 — the earnings multiple is numerically higher relative to the assumed growth rate; whether the stock is expensive depends on business risk, cash flows and growth quality.
Above 2.0 — high relative to the assumed growth rate; not necessarily overvalued.
Treat these as starting points for questions, not answers. A PEG of 0.7 on a company whose “growth” comes from a one-off asset sale isn’t the bargain it appears to be — which is why the inputs matter so much.
Where the PEG Ratio Came From
The PEG ratio was popularized by Peter Lynch, the legendary manager of Fidelity’s Magellan Fund, in his book One Up on Wall Street. Lynch’s frustration was practical: he’d find a great growing company, look at its P/E, and have no quick way to judge whether the growth justified the price. Dividing the P/E by the growth rate gave him that at-a-glance check. His rough rule — a PEG around 1 or below is interesting — is still the most cited version of the interpretation table above.
Getting the Inputs Right
The PEG looks simple, but it has two inputs and both come in flavors. Mixing them carelessly is the most common mistake beginners make.
Which P/E? You can use the trailing P/E (past 12 months of earnings — factual, but backward-looking) or the forward P/E (analysts’ estimates for the next 12 months — forward-looking, but a forecast). Either is defensible.
Which growth rate? Same choice: past earnings growth (what the company did) or projected growth (what analysts think it will do).
Use a documented, consistent methodology across comparisons. Trailing P/E can legitimately be combined with forecast multiyear earnings growth. A trailing P/E paired with a trailing growth rate is consistent. A forward P/E paired with projected growth is consistent. What weakens the comparison is mixing different conventions across companies without disclosing them. The answer may look precise while comparing unlike assumptions.
When you see a PEG quoted on a finance site, check which versions went into it. Provider definitions vary; check the calculation period and source before relying on a quoted figure.
The Weak Link: The Growth Estimate
Here’s the honest part most explainers skip: the PEG ratio is only as good as the growth number you feed it — and growth numbers are guesses.
Analyst projections are wrong with remarkable regularity. A company “expected” to grow at 20% that actually grows at 8% turns your careful PEG of 1.0 into a fantasy. Garbage in, garbage out — the formula can’t save a bad input.
So how do you sanity-check a growth rate before trusting it?
Look at recent history. Has the company actually grown earnings at anything like this rate over the past 3–5 years? Past growth doesn’t guarantee future growth, but a projection wildly above the company’s own track record deserves skepticism.
Read the company’s own guidance. Management teams publish expectations. They’re optimistic by nature, but they’re closer to the business than anyone.
Check the sector trend. A company projected to grow at 25% in an industry growing at 4% needs a convincing story — maybe it has one, but ask for it.
Be conservative. When in doubt, run the PEG with a lower growth number and see if the verdict survives. If a stock only looks cheap under rosy assumptions, it isn’t cheap.
And remember what compounding does to even modest growth over time — the investment growth calculator is a good way to feel how a few percentage points of sustained growth snowball across a decade.
When the PEG Ratio Breaks
Like every ratio, the PEG has situations where it simply doesn’t work:
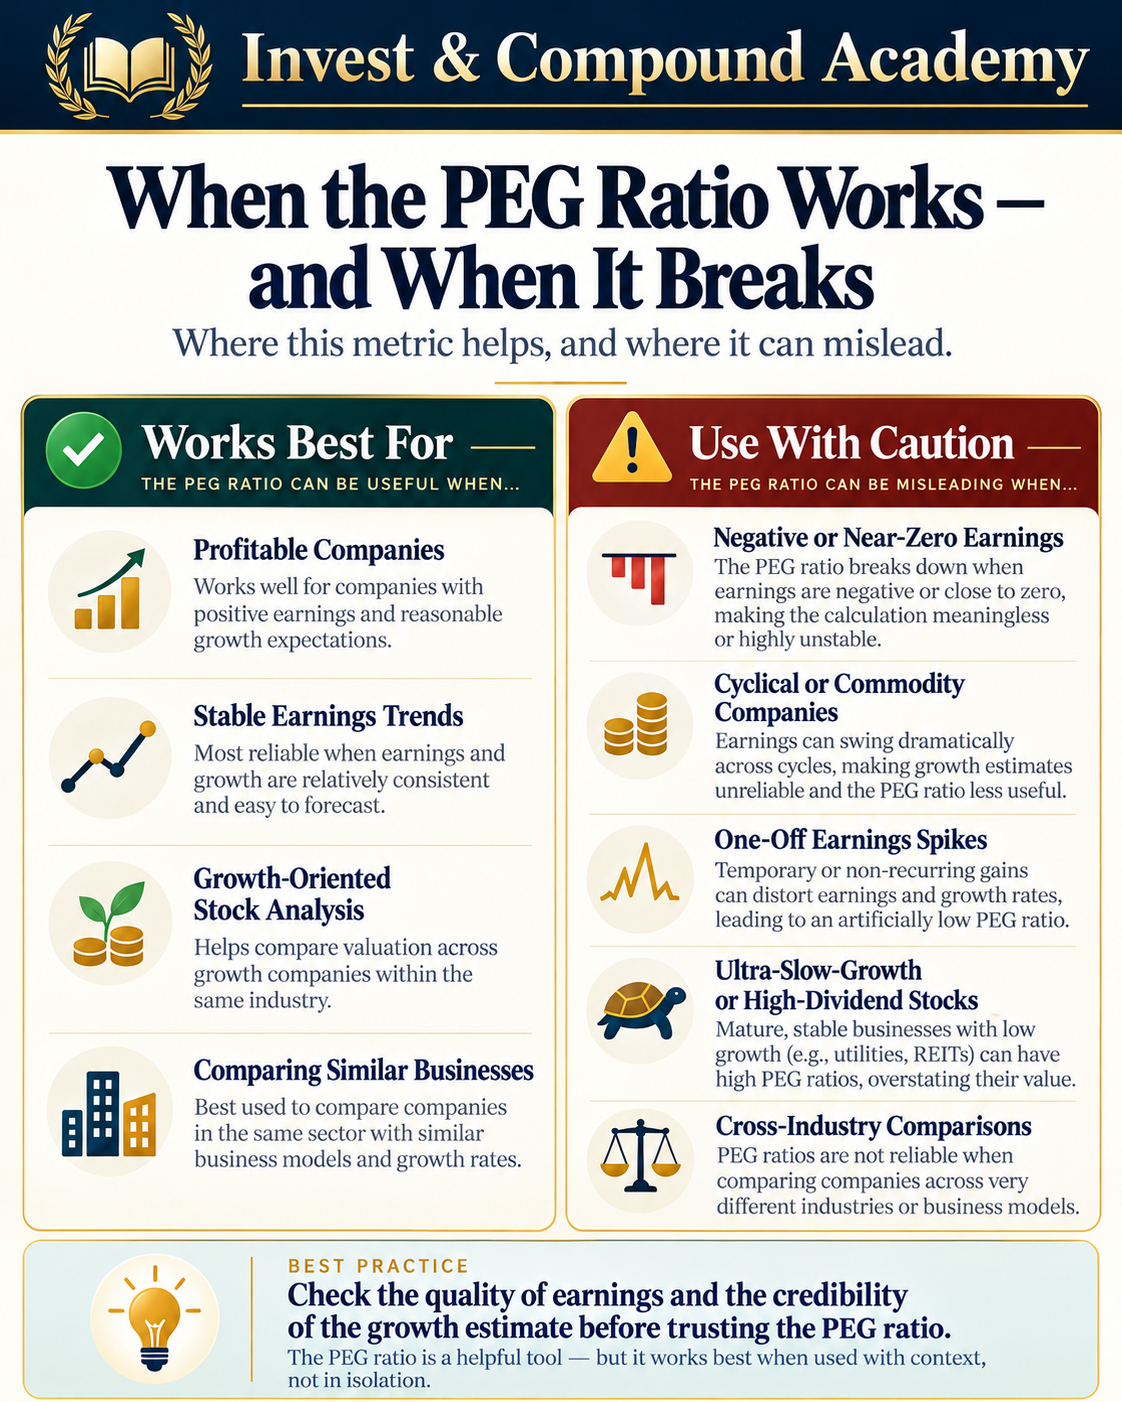
Negative or zero earnings. A conventional PEG becomes unstable or uninterpretable when the P/E is negative or earnings are near zero — the math collapses. Young, unprofitable companies can’t be judged by PEG.
Cyclical and commodity companies. An oil producer’s earnings can triple one year and halve the next. A PEG built on any single growth number is fiction.
No-growth dividend stocks. A mature utility growing at 2% with a P/E of 12 gets a PEG of 6 — “overvalued” by the table, yet possibly a perfectly fine income holding. The PEG penalizes slow growers by design; that doesn’t make them bad investments.
Across industries. Just like the P/E, the PEG shouldn’t be compared between industries. A tech company can sustain a higher PEG than a utility for the same reason it sustains a higher P/E — the market prices different futures.
PEG Ratio vs P/E Ratio
They’re siblings, not rivals:
The P/E ratio tells you what you’re paying per dollar of current profit.
The PEG ratio tells you whether that price makes sense given the growth.
Use the P/E for the quick first glance; reach for the PEG when growth is the story — which, for most stocks worth a second look, it is. For the full breakdown of the P/E side, see our P/E ratio explained guide — the two articles are companion pieces.
Frequently Asked Questions
PEG ratio explained in one sentence?
It’s the stock’s P/E ratio divided by its earnings growth rate — a quick check of whether the price is justified by how fast profits are growing.
Is a PEG below 1 always good?
No. A low PEG built on a fantasy growth estimate is worthless, and some low-PEG stocks are cheap for real reasons (declining business, one-off earnings). The ratio is a starting question, not a buy signal.
What’s a bad PEG ratio?
Roughly speaking, anything above 2 suggests you’re overpaying for the growth on offer — but “roughly” does a lot of work there. Context (industry, earnings quality, the reliability of the growth estimate) matters more than the threshold.
Should I use PEG or P/E?
Use both, in order: P/E for the first glance, PEG when you want to know if the growth justifies the price. Neither works alone.
Can I use the PEG ratio on ETFs?
Not really — at least not directly. An ETF holds dozens or hundreds of companies growing at different rates, so a single growth number doesn’t mean much. Fund-level PEG measures also exist, but their calculation and interpretation require an explicit aggregation method. (For funds, you’re better off understanding what the ETF holds and what it costs — which is a different guide.)
The Bottom Line
The PEG ratio answers the question the P/E leaves open: is this stock’s price justified by its growth? A P/E of 20 produces very different PEG readings at 10% and 25% assumed growth. Whether either stock is attractive depends on the reliability, duration and cash value of that growth.
Its power comes with one big asterisk: the growth estimate. Treat that input with skepticism, keep your horizons consistent, and never let any single ratio make the decision for you.
Next in the valuation series: the forward P/E ratio — what happens when the “E” is a forecast instead of a fact.
Growth assumptions deserve an audit trail
It is tempting to build a PEG model using the growth rate conveniently displayed beside a stock quote. That approach misses several questions. Does the data represent earnings per share or total net income? Is it a one-year estimate or a compound average across several years? Has the analyst consensus been revised recently? Is the denominator based on reported or adjusted earnings? For companies making frequent acquisitions, growth may include the earnings of purchased businesses rather than purely organic expansion. Acquisition-driven increases are not inherently inferior, but they often require new financing and introduce integration risks.
A practical growth-assumption notebook records a base year, EPS convention, projected period, source date and three plausible cases. The optimistic case should not simply add five percentage points to a consensus figure without explanation. Describe the business conditions that would produce it: new customer retention, market share, product mix, price increases or operating margins. The downside case should describe a real mechanism too, such as rising competition, lower utilization or greater dilution. When growth is built from identifiable business drivers, a PEG sensitivity table becomes educational instead of decorative.
Be especially cautious with very small starting earnings. If EPS increases from ten cents to one dollar, the percentage growth is enormous, but the company’s mature economics may still be uncertain. Ratios built from those percentages can swing wildly. Negative EPS creates more profound difficulties: a negative P/E divided by a negative or positive growth figure does not produce a coherent bargain signal under the standard PEG convention. Sometimes the correct output of a calculator is “not meaningful.” A well-designed tool should allow readers to reach that conclusion rather than manufacture a number.
Finally, distinguish growth from value creation. A business can report higher earnings while generating a poor return on newly invested capital. If it spends an additional billion dollars to earn an unremarkable amount of incremental profit, shareholders might prefer a smaller but more efficient business. The PEG formula cannot identify this weakness. Use it alongside reinvestment economics, cash generation and competitive durability, and treat every headline score as an invitation to research rather than an investment verdict.
Growth is not one number: the PEG denominator
Earnings growth needs a starting point, an ending point and a time interval. If diluted EPS rises from $2 to $3.46 over three years, the compounded annual growth rate is approximately 20%, because $2 multiplied by 1.20 three times reaches about $3.46. A single-year increase from $2 to $2.40 is also 20%, but it does not provide the same evidence about durability. Readers should never confuse a one-year forecast with a multi-year CAGR, even if both are displayed simply as “20% growth.”
Consensus earnings forecasts contain another source of uncertainty: which earnings measure is forecast? Companies and analysts may publish adjusted EPS alongside GAAP EPS. A PEG based on adjusted forecasts can look significantly lower than one based on reported diluted earnings, especially when exclusions are recurring. State the basis explicitly. If a company is buying back shares, EPS may rise faster than net income even if the underlying business grows slowly. That distinction is relevant to shareholders, but it means the PEG may be picking up capital-allocation effects rather than operating expansion.
Growth can also be highly sensitive to the starting year. EPS rising from a temporarily depressed 50 cents to $2 looks spectacular in percentage terms. Extrapolating that pace is rarely prudent. Conversely, an expensive investment phase may suppress near-term EPS before producing later cash flows. The PEG compresses a complicated business trajectory into one rate. Good analysis unfolds that trajectory again.
Sensitivity analysis: the same stock, four possible PEG ratios
Suppose an invented company trades at a P/E of 24. Analysts forecast 24% annual EPS growth, implying a PEG of 1.0 under the common whole-percentage convention. That sounds neat until you examine reasonable alternatives. At 18% assumed growth, PEG rises to 1.33. At 12%, it rises to 2.0. At 8%, it rises to 3.0. The stock price has not moved and the P/E has not changed. Only the assumption about tomorrow has changed.
The point is not that 3.0 proves the company overvalued. The point is that a confident claim of “cheap growth” can be extraordinarily sensitive to forecasts. A useful worksheet should therefore display multiple credible growth cases and explain the business conditions behind each. For example, optimistic growth might require new products to scale without margin erosion, a base case might assume steady market-share gains, and a cautious case might reflect stronger competitors or slower end-market demand.
Do not treat the PEG as a discounted cash flow valuation in miniature. It omits how long growth lasts, the cash investment needed to produce it, dilution, financing risk and the terminal economics after rapid growth fades. Even a forecast that proves directionally right may create little shareholder value if it requires continuous issuance of new shares or capital that earns weak returns.
When a low PEG is not a bargain
Picture two fictional businesses. Both trade at a P/E of 18. One has expected EPS growth of 20% but routinely issues shares, suffers customer churn and relies on a narrow product category. The other is expected to grow at 12%, generates strong free cash flow, retains customers and carries little net debt. The first has a PEG of 0.9; the second has a PEG of 1.5. A PEG-only screening process picks the first. A more complete assessment could reasonably prefer the second—or neither—depending on price, risk and evidence.
The familiar below-one rule has historical value as a way to organize questions, but it is not a law of asset pricing. Two firms with the same PEG may deserve different valuations because of business durability, capital intensity, interest-rate exposure, governance and management quality. A slow-growth utility can appear expensive by PEG even when its stable cash generation and dividends are central to its investment case. A commodity company can appear cheap because the forecast starts at a temporary profit peak.
For fund investors, aggregate PEG figures are possible, but provider methodologies vary. Some exclude negative earners; others use different weighting conventions or forecast horizons. Never compare two ETF PEG numbers unless you understand whether they are computed on a consistent basis. It is reasonable to use aggregate growth metrics as background evidence, but they cannot substitute for understanding the funds’ actual holdings.
Finally, consider the difference between a growth rate that looks good in a spreadsheet and a growth rate that can survive competition. A company growing from a very small base may post impressive percentage increases for a brief period. As it becomes larger, maintaining the same pace can demand extraordinary market share, margins or capital. For a PEG exercise, compare what a ten-year continuation of the projected rate would imply for the earnings base. If the result would require an implausible share of the relevant market, reduce the scenario or shorten its duration. Estimate quality should be judged by its business logic, not by whether it lowers the PEG to a preferred threshold. This long-horizon reality check helps readers avoid mistaking mathematical compounding for a forecast the business can deliver.
For the reader building a permanent investing routine, the most valuable output is not the PEG score but the written interpretation. Record whether growth comes primarily from volumes, pricing, margins, acquisitions or lower share count. Mark which assumptions rely on current company disclosures and which rely on analyst forecasts. If an estimate changes, preserve the earlier version so you can trace the reason for the change. This record becomes especially useful when a stock price moves sharply after earnings: you can check whether the business thesis changed or the market simply repriced a familiar risk. A disciplined research process is also less vulnerable to cherry-picking: you cannot quietly swap to a more optimistic growth rate merely because your first calculation did not support the result you hoped to see. The score may be a starting filter, but the documented assumptions are the substance of the analysis. Never describe a low PEG as evidence of a guaranteed return, and do not use it as a replacement for diversification or a careful assessment of liquidity needs.
A final research exercise
Choose two fictional or real companies with positive earnings. Record the same P/E convention and growth-forecast interval for each. Recalculate PEG at the original assumed growth rate and at rates one-third lower and one-third higher. Note the changes, then inspect debt, dilution and cash conversion. The exercise is successful when you can explain why one number did or did not change your view, not when you arrive at a purchase recommendation.
Investor takeaway
The PEG ratio is most useful as a stress test of the growth narrative. The formula takes seconds; defending a long-run earnings growth assumption can take hours. That is not a limitation to hide—it is the lesson.
PEG ratio and growth sensitivity
This tool uses illustrative assumptions for educational purposes. It does not forecast investment returns or recommend transactions.
Stock Valuation and Growth Research
References & Official Data Sources
For related research, consult the existing P/E valuation pillar and How to Read a Stock. Related draft articles will be linked once their publication is approved and their URLs are live.
For issuer financial reporting terminology and investor disclosures, see the SEC EDGAR filing database. All stock examples are hypothetical.