Market Correction Warning Signs: How to Assess Rising Risk
Understand valuations, breadth, earnings, credit spreads and volatility—with worked examples that separate observable vulnerability from uncertain market forecasts.
Market correction warning signs can reveal vulnerabilities, but they cannot tell you when stocks will fall. Stock market corrections rarely announce themselves in advance. Prices may rise steadily for months, investor confidence may remain strong, and corporate earnings may continue improving before a relatively small development triggers a significant reassessment of risk. Sometimes the catalyst is an unexpected inflation report. On other occasions, disappointing corporate earnings, geopolitical uncertainty, financial-system stress, or changing interest-rate expectations cause investors to reconsider the prices they are willing to pay for financial assets.
As selling pressure spreads, a market that recently appeared stable can decline rapidly. This creates an understandable question: Are there warning signs investors can recognize before a market correction begins? The answer is more complicated than many investment forecasts suggest. Financial indicators can reveal increasing vulnerabilities. Elevated valuations may indicate that prices depend on optimistic future expectations. Deteriorating market breadth can show that fewer companies are supporting an index advance. Widening credit spreads may signal increasing financial stress, while weakening earnings estimates can suggest that business fundamentals are becoming less favorable.
However, none of these indicators reliably predicts the exact timing of a stock market decline. A market can remain expensive for years. Market breadth can deteriorate without producing an immediate correction. Credit spreads may widen temporarily before stabilizing, and volatility can increase after a substantial decline has already occurred. The distinction between identifying risk and forecasting a market turning point is fundamental. Investors who interpret every negative indicator as an instruction to sell may repeatedly exit markets that continue advancing. Those who disregard vulnerabilities altogether may underestimate the consequences of leverage, concentration, or deteriorating liquidity.
A more useful approach to market correction warning signs is to evaluate indicators together, understand the economic relationships they represent, and consider whether changing market conditions affect the suitability of an existing investment strategy. The Federal Reserve’s financial-stability framework provides a valuable foundation for this analysis. It distinguishes shocks, which are inherently difficult to predict, from underlying vulnerabilities that may amplify losses when adverse events occur. This guide applies that distinction to equity investing.
It examines market valuations, earnings revisions, market breadth, volatility, credit spreads, interest rates, yield curves, economic indicators, leverage, liquidity, and investor sentiment. It also explains common false signals, develops an illustrative market-risk dashboard, and shows how investors can evaluate potential downside without relying on claims of precise market prediction. The objective is not to identify the date of the next correction. It is to understand the conditions that can make financial markets more vulnerable—and to respond with appropriate risk management rather than speculation.
Market Correction Warning Signs: Risk Versus Prediction
A completed market correction is conventionally classified as a decline of at least 10% but less than 20% from a reference high. A decline of 20% or more is usually called a bear market. In real time, a correction can deepen; use the same index and closing-price or intraday convention throughout. To predict one reliably, an investor would need to identify not only that prices are vulnerable but also when selling pressure will begin, how far the decline will extend, and whether the market will recover before or after a particular trading decision.
These requirements create substantial difficulty. Market prices reflect expectations about future conditions. Those expectations incorporate information from many investors with different objectives, resources, and investment horizons. A development that appears negative may already be reflected in market prices. Conversely, information that seems relatively modest can produce a large reaction if it differs sharply from expectations. For example, suppose investors expect corporate earnings to increase 15% over the coming year. If new forecasts suggest growth of only 5%, share prices may decline even though earnings are still expected to increase.
The market is responding to a deterioration relative to previous expectations. The reverse can also occur. A company may report falling profits, yet its stock rises because the outcome is better than investors feared. This forward-looking behavior complicates attempts to predict corrections using economic information alone.
Leading Indicators Are Not Certain Indicators
A leading indicator is a variable that may change before another economic or financial development. However, leading indicators are imperfect. They can produce false positives, indicating risk without a subsequent correction. They can also fail to identify downturns triggered by unexpected events. The relevant analytical questions are whether an indicator has a meaningful economic relationship with market risk, how that relationship has behaved historically, and whether the indicator provides information not already contained in other measurements.
Risk Monitoring Versus Market Timing
Risk monitoring assesses financial conditions and portfolio vulnerabilities. Market timing attempts to improve investment returns by forecasting when to enter or exit the market. These activities are related but different. An investor may conclude that equity valuations are elevated and that a concentrated portfolio carries substantial downside risk. Reducing concentration could be reasonable even without predicting that a correction will occur next month. By contrast, selling a diversified retirement portfolio solely because one technical indicator has weakened depends heavily on the indicator’s forecasting ability.
Risk management can remain valuable even when the precise timing of a market decline is unknown.
Start with what a market correction means and the correction versus bear market distinction. This guide focuses on interpreting warning indicators, rather than estimating a correction’s historical duration.
Framework source: the Federal Reserve’s May 2026 Financial Stability Report separates difficult-to-forecast shocks from vulnerabilities that can be monitored. This article adapts that distinction for education; the Fed does not endorse the illustrative dashboard.
Market Correction Warning Signs in Stock Valuations
Valuation is one of the most widely discussed indicators of potential market vulnerability. A stock’s market price reflects investors’ expectations about future earnings, cash flows, growth, and risk. When prices rise faster than the economic fundamentals supporting them, valuation multiples may become increasingly demanding. This can make prices more sensitive to disappointing developments.
Understanding the Price-to-Earnings Ratio
The price-to-earnings ratio compares the market price of a stock with its earnings per share.
Suppose a company trades at $150 per share and is expected to earn $5 per share. Its forward P/E ratio is 30. If the share price rises to $200 while expected earnings remain unchanged, the ratio increases to 40. Investors are now paying more for each dollar of anticipated earnings. The higher valuation may be justified if future growth expectations improve. However, if expected earnings do not increase, the stock becomes more sensitive to changes in required returns or investor sentiment.
How Valuation Compression Creates Losses
Imagine a company expected to earn $6 per share. At a forward P/E ratio of 30, its implied price is $180. If investors subsequently become willing to pay only 24 times earnings, the implied price falls to $144. That represents a 20% decline despite unchanged expected profits. This demonstrates why significant market losses can arise without an equivalent decline in current business performance.
The Shiller CAPE Ratio
The cyclically adjusted price-to-earnings ratio, commonly associated with economist Robert Shiller, compares equity prices with average inflation-adjusted earnings over a ten-year period. The objective is to reduce the influence of short-term earnings fluctuations. CAPE can provide perspective on long-term valuation conditions. However, it has limitations. Accounting practices, sector composition, interest rates, profitability, and other economic characteristics change over time. An elevated CAPE ratio does not mean a correction must occur immediately. Markets can remain expensive for extended periods.
Equity Risk Premium
The equity risk premium is the additional return investors require or expect from equities relative to a lower-risk benchmark, commonly represented by government securities. A compressed estimated premium may indicate that investors are accepting relatively little compensation for equity risk. However, estimating the premium requires assumptions about future earnings, growth, payouts, and discount rates. Different models can produce different results.
Why Valuations Are Poor Short-Term Timers
Valuation measures often provide more useful information about long-horizon prospective returns than near-term market movements. A market with elevated valuations may continue rising because earnings improve or investors remain willing to accept lower required returns. A market with modest valuations may continue falling if business fundamentals deteriorate. Valuation should therefore be treated as an indicator of sensitivity to disappointment, not a reliable countdown to a correction.
For the denominator, forecast horizon and limitations behind this measure, see P/E ratios explained. Compare forward estimates with forward estimates, rather than silently switching to trailing earnings.
Warning Sign: Weakening Market Breadth
Market breadth examines how widely a market advance or decline is distributed across individual securities. A major index may continue rising even when a substantial portion of its constituents are declining. This can occur because capitalization-weighted indexes assign greater influence to larger companies. If a small group of highly valued companies performs exceptionally well, those gains may outweigh weakness elsewhere.
Why Index Concentration Matters
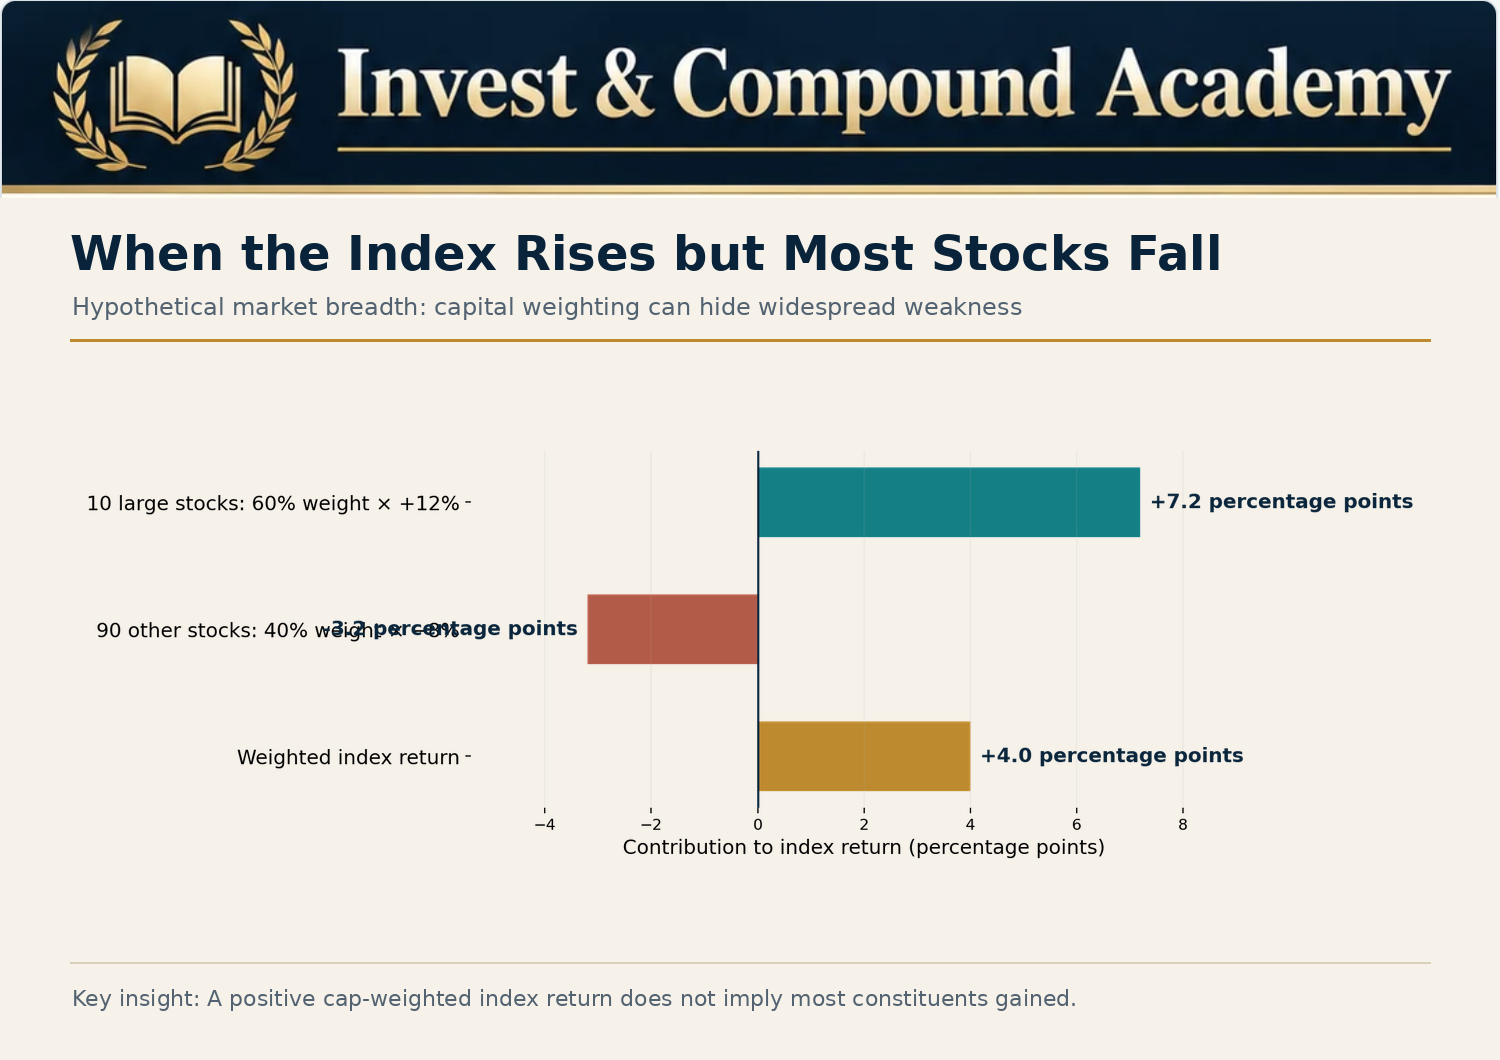
Imagine a hypothetical index containing 100 companies. Ten large companies represent 60% of its weight, while the remaining 90 companies represent 40%. Suppose the ten large companies gain 12%, while the other 90 decline 8%. The weighted contribution from the large companies is positive 7.2 percentage points. The contribution from the remaining companies is negative 3.2 percentage points.
Using starting weights and assuming no constituent changes or intervening rebalancing, the overall index rises 4%: (0.60 × 12%) + (0.40 × −8%) = 4%. Assume all 90 smaller constituents decline, with a weighted group return of −8%; their individual losses need not be identical. Yet 90% of the companies have declined. The headline index return therefore conceals broad weakness.
Advance-Decline Line
The advance-decline line accumulates the difference between the number of advancing and declining securities. For a given session:
If 1,400 stocks advance and 2,100 decline, net advances equal negative 700. A cumulative advance-decline measure adds each session’s net advances to a running total. When a market index reaches new highs while the advance-decline line weakens, analysts may describe a breadth divergence. Such a divergence can suggest narrowing participation. However, it does not prove that a correction is imminent.
Percentage Above Moving Averages
Analysts also examine the percentage of index constituents trading above their 50-day or 200-day moving averages. Suppose an index rises while the proportion of stocks above their 200-day moving averages falls from 75% to 45%. The change suggests that fewer constituents remain in sustained upward trends. This can indicate weakening participation, but the interpretation depends on sector weights and market conditions.
New Highs Versus New Lows
Another breadth measure compares the number of stocks reaching new 52-week highs with those reaching new 52-week lows. An increasing number of new lows may suggest expanding weakness. However, different securities have different volatility profiles and historical price distributions. The observation should be interpreted alongside other measures.
Why Breadth Signals Can Fail
Market leadership can remain concentrated for long periods. Large profitable companies may continue generating strong returns while weaker businesses struggle. Additionally, equal-weighted and capitalization-weighted indexes can behave differently for legitimate structural reasons. Among market correction warning signs, deteriorating breadth is a reason for closer analysis rather than an automatic sell signal.
The guide to how the S&P 500 works explains why capitalization weighting gives large companies greater influence over headline returns.
Warning Sign: Deteriorating Corporate Earnings Expectations
Equity valuations depend partly on expected future corporate profits. When analysts begin reducing earnings forecasts across multiple industries, the market may face pressure from deteriorating fundamentals. A particularly challenging environment occurs when earnings expectations fall while valuation multiples also contract.
Earnings Revisions
Analysts regularly update their forecasts based on company guidance, economic developments, industry conditions, and reported results. The direction and breadth of these revisions can provide information about changing expectations. An earnings-revision breadth measure might compare the number of upward and downward forecast changes. A growing predominance of downward revisions may suggest a less favorable profit outlook. However, not all revisions carry equal importance. A modest forecast reduction for a small company is not equivalent to a substantial change in expected profits for a heavily weighted index constituent.
Earnings Surprises
A company can report positive earnings growth while still disappointing investors. For example, if analysts expect earnings per share of $3.00 and the company reports $2.80, the result may be viewed unfavorably even if earnings rose from $2.50 the previous year. The negative surprise concerns expectations, not whether profitability is positive.
Profit Margin Pressure
Corporate earnings depend on revenue and operating costs. Rising labor expenses, financing costs, tariffs, or raw-material prices can reduce margins when companies cannot fully pass increases to customers. A broad deterioration in margins may weaken profit growth even when sales remain relatively stable.
Earnings and Valuation Together
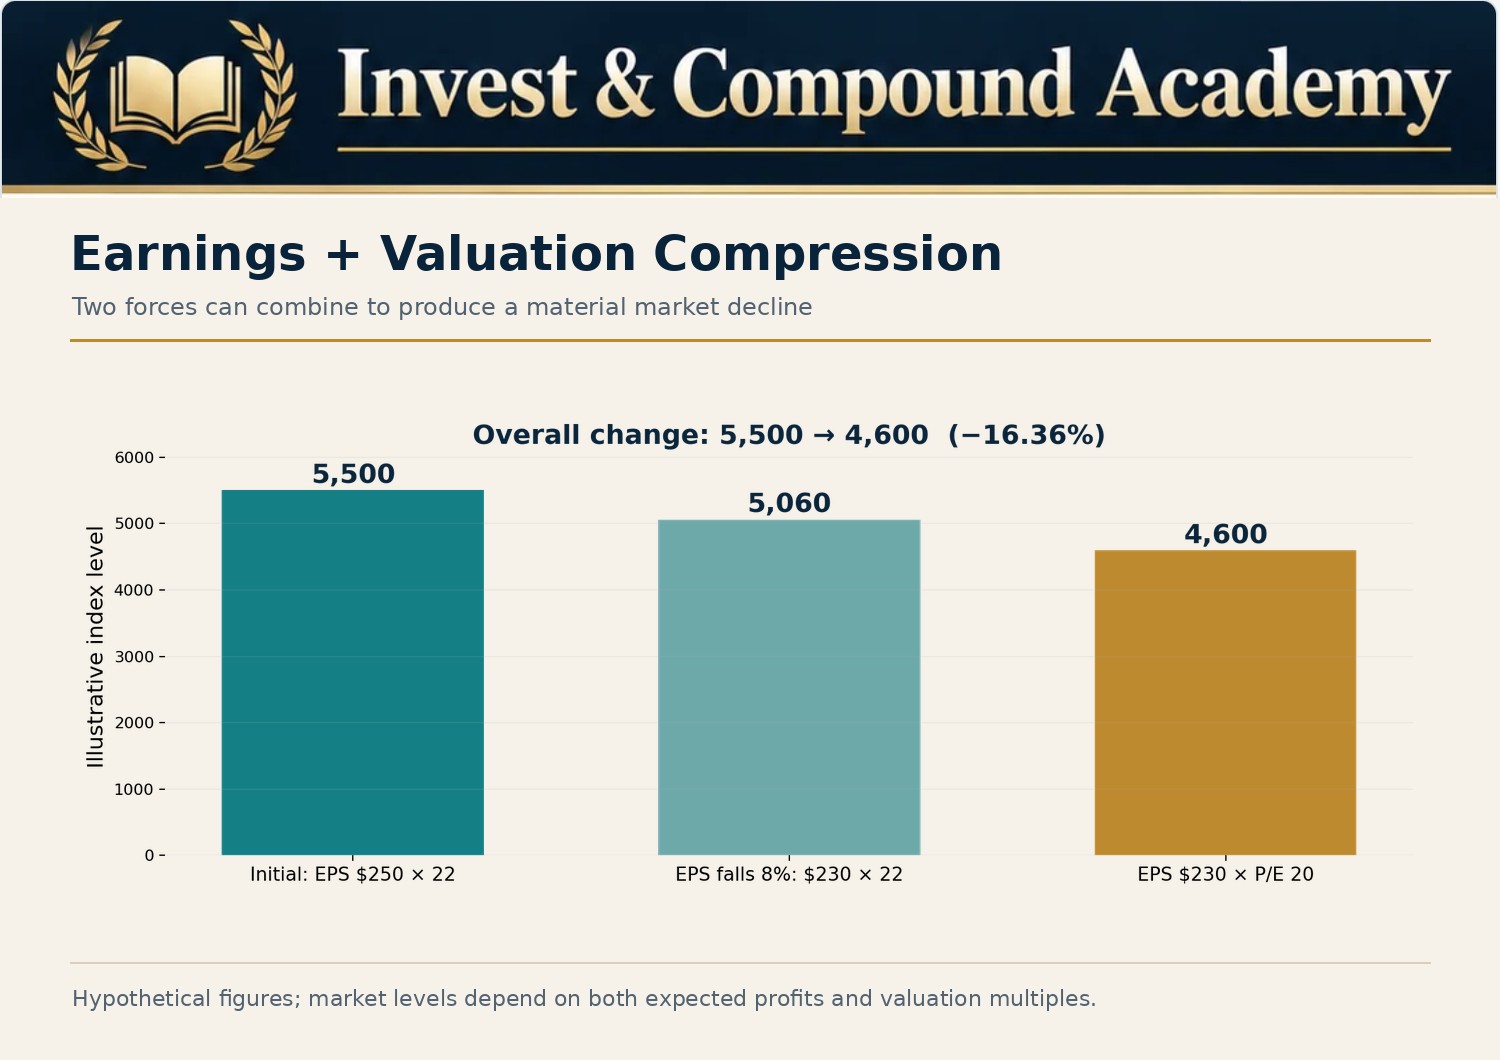
Suppose an index has expected earnings of $250 and trades at 22 times those earnings. Its implied level is 5,500. If earnings expectations fall 8% to $230 while the valuation multiple declines to 20, the implied level becomes 4,600. The decline is approximately 16.36%. Neither earnings deterioration nor valuation compression alone explains the full decline. The combination is more powerful.
Limitations of Earnings Indicators
Analyst forecasts can lag economic developments. Estimates may be revised after share prices have already fallen. Also, markets sometimes recover while published earnings forecasts remain weak because investors anticipate future stabilization. Earnings revisions are therefore useful for evaluating fundamentals but insufficient for forecasting the exact market bottom.
Warning Sign: Widening Corporate Credit Spreads
Credit spreads measure the additional yield investors demand for holding riskier debt relative to a reference benchmark. For corporate bonds, this often means comparing the yield of a corporate security with a government yield or another benchmark of comparable maturity. A widening spread can indicate increasing concerns about credit risk, liquidity, or economic conditions.
A Simple Credit Spread Example
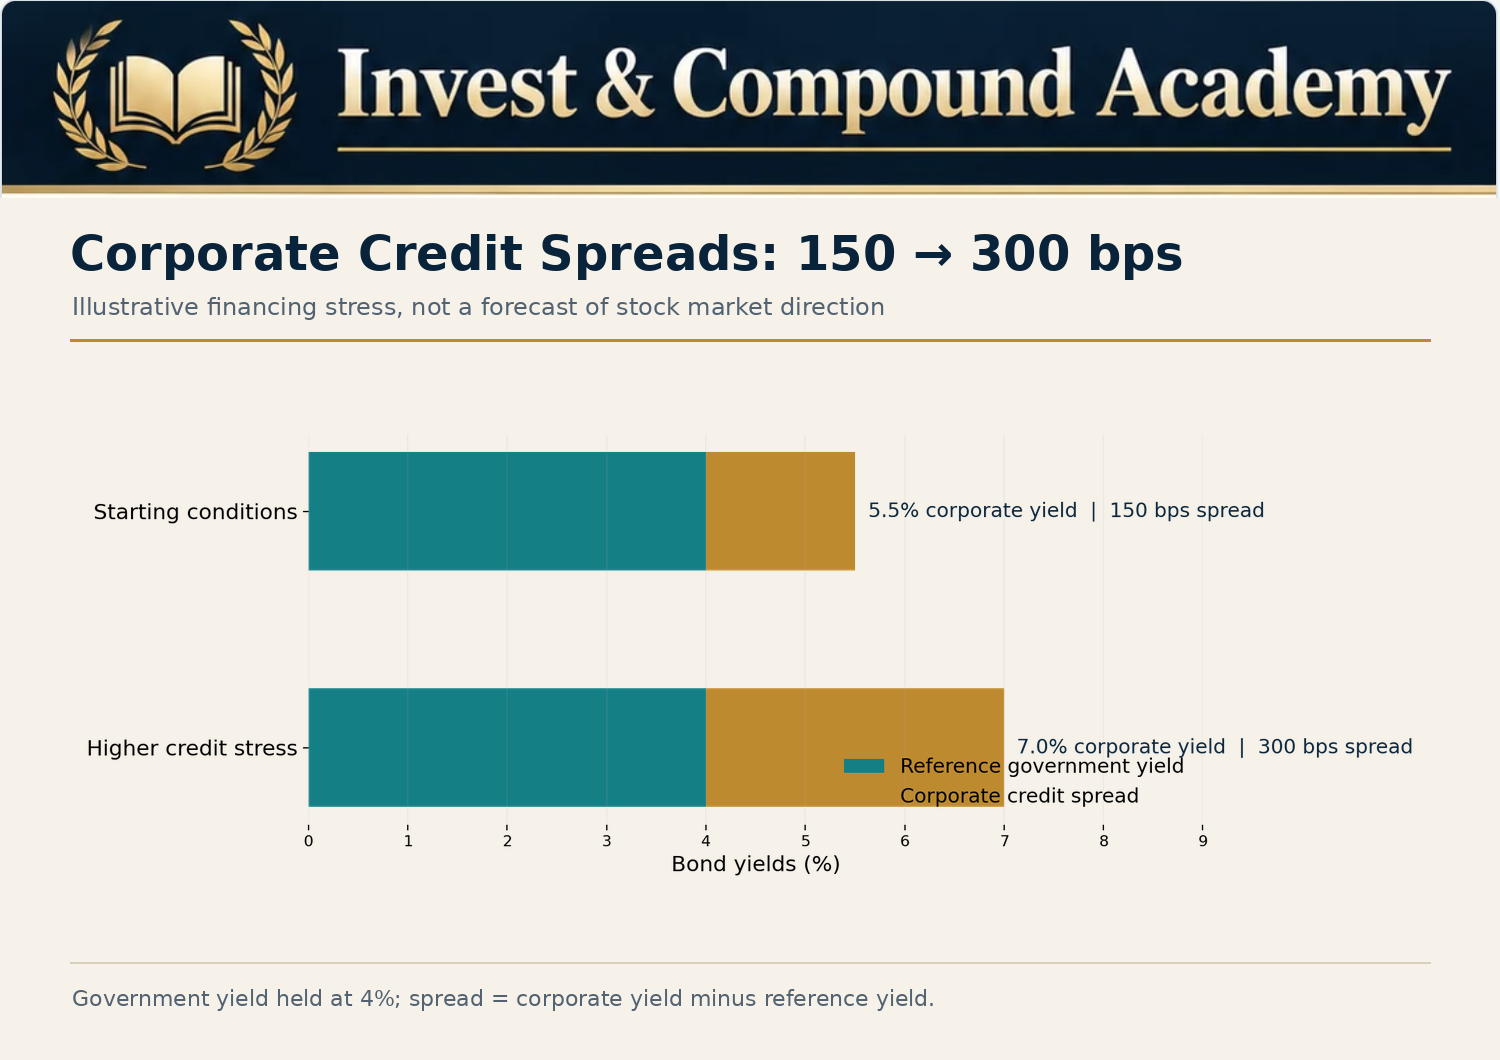
Suppose a government bond yields 4%. A comparable-maturity corporate bond yields 5.5%. The spread is 1.5 percentage points, or 150 basis points. If the corporate bond’s yield rises to 7% while the benchmark remains at 4%, the spread widens to 300 basis points. The additional compensation demanded by investors has increased. This can reflect concern about defaults, weaker business conditions, reduced liquidity, or changing risk appetite.
Investment-Grade Versus High-Yield Credit
Investment-grade corporate bonds generally have stronger credit ratings than high-yield bonds. High-yield spreads may respond more sharply to concerns about recession and financial distress. A broad widening of spreads across credit categories can indicate that investors are reassessing financial risk.
Why Credit Conditions Affect Equities
Many businesses depend on borrowing to finance operations, investment, and debt refinancing. Higher financing costs can reduce profits. Companies with heavy debt burdens may face additional pressure. When financing becomes less accessible, investment spending may weaken. These developments can influence equity valuations.
Credit Spreads Are Not a Perfect Predictor
Spreads can widen because of temporary liquidity problems or changes in market positioning. They may also remain compressed during extended periods of optimism. A widening spread does not automatically mean a recession or equity correction will occur. When evaluating credit spreads as market correction warning signs, examine the magnitude, persistence, and economic drivers of the change.
Data distinction: a simple corporate-minus-government yield spread is not identical to an option-adjusted index spread. FRED’s ICE BofA U.S. High Yield OAS series reports percentage points: 3.00 corresponds to 300 basis points. Check units, benchmark, option adjustment, observation dates and licensing before using or reproducing a series. The 150-to-300 basis-point example here is hypothetical.
Warning Sign: Rising Market Volatility
Volatility measures the variability of investment returns. When market uncertainty increases, the range of expected or realized price movements may expand. One widely followed indicator is the Cboe Volatility Index, commonly called the VIX.
What the VIX Actually Measures
The VIX reflects a market-based estimate of expected S&P 500 volatility over approximately the next 30 days, derived from prices of S&P 500 index options. It is expressed as an annualized volatility measure. Importantly, it is not a directional forecast. A high VIX does not tell investors whether stocks will rise or fall. It reflects expectations of larger movements.
Interpreting a VIX Reading
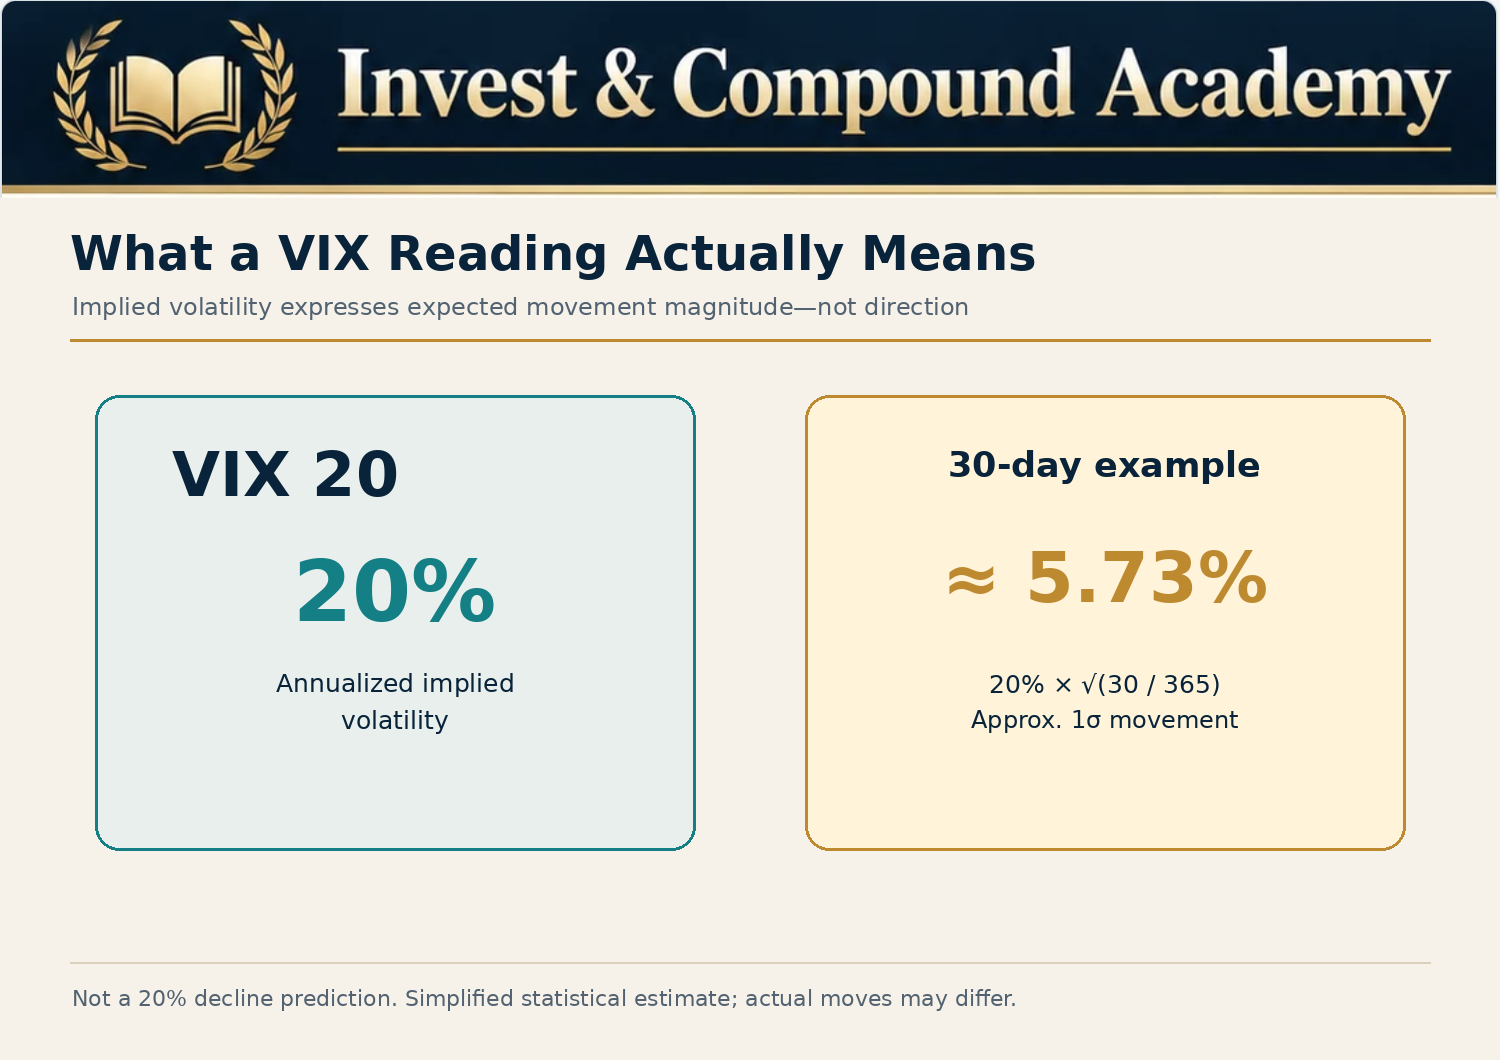
A VIX level of 20 represents approximately 20% annualized implied volatility under the index’s methodology. It does not mean the S&P 500 is expected to decline 20% over the next month. A simplified one-standard-deviation 30-day movement estimate can be approximated using: Expected 30-day volatility ≈ Annualized volatility × √(30 ÷ 365) At a VIX level of 20, the resulting 30-day volatility estimate is approximately 5.73%.
This square-root-of-time approximation treats variance as scaling with time. It is a rough statistical interpretation, not the VIX calculation itself, a calibrated probability range, or a directional price prediction. The option-implied measure also embeds risk pricing; it is not a pure estimate of the real-world probability of each return. Real financial returns can exhibit skewness, jumps, fat tails, and other characteristics that make simple normal-distribution assumptions imperfect.
Why Volatility Often Increases During Declines
When equities fall, investors may seek downside protection. Demand for put options can increase. Options prices may reflect a greater expected range of future outcomes. Financial institutions may also adjust hedging positions as market conditions change. These processes can contribute to higher implied volatility.
The Important Timing Limitation
Volatility frequently increases after markets have already begun declining. The VIX can therefore act as a concurrent measure of stress rather than a reliable early-warning signal. It may also rise near a market trough when investor fear is unusually elevated. A high reading can occur before further declines or before a substantial rebound.
The Proper Use of VIX Data
Investors can use implied volatility to understand changing market uncertainty and evaluate options-related risks. It should not be interpreted as a simple instruction to buy or sell equities.
Warning Sign: Changes in Treasury Yields and the Yield Curve
Government bond yields influence the pricing of many financial assets. Changes in yields can affect borrowing costs, corporate valuations, consumer spending, and investor preferences. A substantial rise in required yields may pressure equity valuations. However, the economic meaning depends on why yields are moving.
The Role of Discount Rates
A simplified valuation model discounts expected future cash flows to their present value. When discount rates increase, the present value declines, all else being equal. A Treasury yield is only one input to an equity discount rate; it is not interchangeable with the required return on stocks. Consider a hypothetical payment of $100 received in ten years. At a discount rate of 5%, its present value is approximately $61.39. At 8%, the present value falls to approximately $46.32. The expected payment is unchanged. Its valuation changes because the required return changes.
Rising Yields Are Not Always Negative
Bond yields can rise because economic growth expectations improve. In that environment, stronger expected corporate earnings may partly or fully offset the valuation impact of higher discount rates. Yields can also rise because inflation expectations increase or investors demand a larger term premium. Those circumstances may have different implications for equities. Therefore, an increase in the 10-year Treasury yield should not automatically be interpreted as a correction signal.
The Yield Curve
The yield curve compares interest rates across different maturities. Under many ordinary conditions, longer-term yields exceed shorter-term yields. An inverted yield curve occurs when selected shorter-term yields exceed longer-term yields. Certain yield-curve inversions have historically preceded U.S. recessions. However, a recession indicator is not automatically a stock-market correction predictor. The timing between an inversion, economic downturn, and equity-market decline can vary substantially.
Why Yield-Curve Signals Have Limitations
Interest-rate expectations, monetary policy, term premiums, and global demand for government bonds all influence the yield curve. An inversion may persist while equities continue rising. Similarly, the yield curve can normalize for different reasons. It may steepen because short-term rates fall or because long-term rates rise. Those scenarios have different economic implications. Investors should examine the components rather than assume that every yield-curve movement has the same meaning.
Warning Sign: Weakening Economic Activity
Economic indicators can reveal whether growth conditions are improving or deteriorating. Although stock markets are forward-looking, economic weakness can ultimately affect corporate profits and risk appetite. Several indicators deserve attention.
Employment
Labor-market conditions influence household income and consumer spending. A sustained increase in unemployment may signal weaker demand for labor. However, unemployment often responds after economic conditions have already begun deteriorating. It can therefore be a lagging indicator.
Initial Unemployment Claims
Initial claims for unemployment insurance provide a higher-frequency measure of labor-market developments. A persistent increase may suggest growing layoffs. However, weekly data can be volatile and affected by seasonal patterns and administrative factors. The trend is generally more informative than one observation.
Manufacturing Activity
Purchasing managers’ indexes and manufacturing surveys can provide information about production, new orders, inventories, and business expectations. Weakening new orders may indicate softer future activity. However, manufacturing represents only part of the economy. A weak manufacturing survey does not necessarily imply that the entire economy is contracting.
Consumer Spending
Consumer spending is important to U.S. economic activity. Slowing spending growth may reduce revenue expectations for consumer-oriented companies. However, shifts in consumption between goods and services can complicate interpretation. Nominal spending may also rise because prices are increasing rather than because consumers are purchasing more goods and services.
Retail Sales and Inflation Adjustments
Investors should distinguish nominal economic data from inflation-adjusted measures. For example, nominal sales growth of 4% alongside price inflation of 5% does not necessarily imply that the volume of goods and services purchased has increased. Understanding real activity provides additional context.
Economic Indicators and Market Timing
Markets can decline before economic data weaken and recover before economic data improve. This timing difference limits the usefulness of economic statistics as exact trading signals. Their greater value lies in evaluating whether earnings expectations and financial conditions remain consistent with prevailing asset prices.
Warning Sign: Excessive Financial Leverage
Leverage allows investors and institutions to control asset exposures larger than their own capital. Borrowing can increase returns when asset prices move favorably. It also magnifies losses and can create forced selling during downturns. The Federal Reserve identifies leverage as one of the major categories of financial-system vulnerability.
A Simple Leverage Example
Suppose an investor purchases $100,000 in securities using $50,000 of personal capital and $50,000 of borrowed money. If the securities fall 20%, their value declines to $80,000. The loan remains $50,000, excluding interest. The investor’s equity is now $30,000. The underlying investment declined 20%, but personal capital declined 40%.
Margin Calls
A broker may require additional collateral when account equity falls below specified maintenance requirements. The investor may need to deposit funds or sell investments. If many leveraged investors face similar pressure, forced selling can intensify market declines.
Hedge Fund and Institutional Leverage
Financial institutions and investment funds may use derivatives, repurchase agreements, and other financing structures. The risks depend on position size, asset liquidity, collateral requirements, and counterparty relationships. A position that appears manageable under normal market conditions can become difficult to finance during stress.
Why Leverage Is Difficult to Observe Completely
Public margin-debt statistics provide only a partial view of market borrowing. Not all derivatives exposures, institutional positions, and financing arrangements are captured in one measure. An increase in observed leverage can suggest growing vulnerability, but it does not establish the timing of a correction.
Warning Sign: Market Liquidity Is Deteriorating
Market liquidity refers to the ability to buy or sell assets without causing large price changes. Liquid markets generally support transactions with relatively narrow spreads and sufficient available buyers and sellers. During stress, liquidity can decline.
Bid-Ask Spreads
The bid is the price a buyer is offering. The ask is the price a seller is requesting. The difference is the bid-ask spread. Wider spreads can indicate higher trading costs or reduced willingness to provide liquidity. However, spreads depend on security characteristics, market conditions, and trading volume.
Market Depth
Market depth reflects the amount of buying and selling interest available at different price levels. A market with limited depth may experience large price movements when a substantial order arrives.
Funding Liquidity
Funding liquidity refers to the ability of investors and institutions to obtain financing or meet cash obligations. A financial institution can hold assets with substantial long-term value but still experience liquidity difficulties if obligations come due before those assets can be sold or financed appropriately.
Liquidity Feedback Loops
Falling asset prices can reduce collateral values. Reduced collateral can force investors to sell assets. Those sales may put additional pressure on prices. This feedback loop can magnify declines.
Liquidity Signals Are Often Most Visible During Stress
Deteriorating liquidity can help explain why market movements become severe. But liquidity conditions may change rapidly, and meaningful deterioration may not appear until a decline is already underway. Investors should treat liquidity analysis as part of broader risk assessment, not a dependable advance alarm.
Warning Sign: Extreme Investor Sentiment
Investor sentiment describes the degree of optimism or pessimism reflected in surveys, positioning, options markets, and trading behavior. Extreme optimism can be associated with elevated risk-taking. However, optimism alone does not cause a market correction.
Investor Surveys
Surveys ask participants about expectations for future market performance. A high proportion of bullish respondents may indicate widespread optimism. However, survey participants are not always representative of all market participants, and expressed opinions do not necessarily correspond to actual portfolio positioning.
Put-Call Ratios
The put-call ratio compares put-option activity with call-option activity. An increase in put activity relative to calls may reflect greater demand for downside protection. But options are used for many purposes, including hedging, income generation, and complex trading strategies. A high put-call ratio does not necessarily represent a directional prediction.
Fund Flows
Large inflows into equity funds can suggest strong demand. However, inflows can continue during a prolonged market advance. They may also reflect retirement contributions or changes in investment preferences rather than short-term speculation.
Extreme Optimism and Contrarian Analysis
Some investors interpret extreme optimism as a contrarian warning because widespread bullish positioning may leave fewer incremental buyers. However, that interpretation depends on assumptions about positioning and future demand. Sentiment can remain extreme for extended periods. Using it as a standalone sell signal can produce repeated errors.
Fear Can Also Be Misleading
Extreme pessimism may coincide with market bottoms, but it can also precede further losses. Investor sentiment should be interpreted alongside fundamentals, valuations, liquidity, and financial conditions.
Warning Sign: Weakness in Small-Cap and Cyclical Stocks
Different market segments respond to economic conditions in different ways. Small-capitalization companies may be more sensitive to domestic financing conditions, borrowing costs, and economic demand. Cyclical industries such as industrials, consumer discretionary businesses, and selected financial companies may react strongly to changes in growth expectations.
Why Small Companies Can Be Vulnerable
Some smaller companies have less diversified revenue streams and more limited access to financing. Higher borrowing costs or weaker demand may affect them disproportionately. However, small-cap indexes contain a wide range of businesses. Their relative performance also depends on valuations, sector composition, and investor preferences.
Defensive Versus Cyclical Leadership
When investors become concerned about economic growth, they may favor businesses considered relatively defensive. Examples can include selected consumer staples, utilities, or health care companies. However, no sector is immune to losses. Defensive leadership can reflect legitimate differences in earnings resilience or valuation rather than an imminent broad-market downturn.
Relative Strength Analysis
Investors sometimes compare a small-cap index with the S&P 500 or compare cyclical sectors with defensive sectors. A sustained deterioration in relative performance may suggest changing risk preferences. But relative weakness does not guarantee that the broad market will decline. It is one contextual indicator among many.
Warning Sign: Unusually Strong Speculation
Speculative behavior can become widespread during prolonged market advances. Investors may focus increasingly on rapid gains, leverage, and narratives of exceptional future returns. Some securities may trade at prices that require highly optimistic assumptions about future business success.
Speculation Versus Investment
Speculation is not defined simply by purchasing a volatile security. The distinction often concerns the investor’s analytical process and dependence on future resale prices. An investment case based primarily on the expectation that another buyer will pay substantially more, without reasonable support from future cash flows or other economic value, may be fragile.
Concentrated Trading Themes
Strong interest in a narrow investment theme can create crowded positions. If expectations change, many participants may attempt to reduce similar exposures simultaneously. However, high investor interest does not automatically imply that a theme is unjustified. Technological innovation and structural economic developments can produce genuine growth opportunities. The question is whether valuations reasonably reflect the range of potential outcomes.
Leverage and Speculation Together
Speculative positions financed with borrowing can become especially vulnerable. Falling prices may trigger forced liquidation, amplifying volatility.
Why Speculation Can Continue Longer Than Expected
Investors sometimes identify excessive valuations well before a correction occurs. But speculative enthusiasm can persist for months or years. An apparently correct long-term warning can still produce poor trading results if used to make repeated short-term market-timing decisions.
How Market Correction Warning Signs Interact
Several deteriorating indicators can reveal interacting vulnerabilities, although the combination does not establish their probability of producing a correction. A single weak measure may provide limited information. A combination of elevated valuations, falling earnings expectations, widening credit spreads, increasing leverage pressure, and deteriorating liquidity may indicate a more challenging financial environment. However, even such a combination does not guarantee that a correction will occur by a particular date.
A Hypothetical Market Scenario
Imagine an equity market with the following characteristics: The forward P/E ratio is elevated relative to its own historical range. Large companies continue supporting the headline index, but broad market participation is weakening. Corporate earnings estimates have begun declining. High-yield credit spreads are widening. Implied volatility has increased. At the same time, short-term financing has become more expensive for leveraged investors. These developments suggest several interacting vulnerabilities. High valuations create sensitivity to disappointment. Weaker earnings threaten the fundamental support for prices. Credit deterioration increases financial pressure.
Leverage and liquidity constraints can amplify selling if an adverse shock occurs.
Why Interaction Matters
The Federal Reserve’s financial-stability framework emphasizes that vulnerabilities can reinforce one another during periods of stress. This principle applies to portfolio risk. An expensive market is not automatically unstable. A leveraged market is not automatically about to collapse. But expensive assets financed with substantial borrowing in an environment of deteriorating credit and liquidity can be more vulnerable to adverse developments.
Avoid Double-Counting Signals
Indicators are often correlated. A market decline may simultaneously produce weaker breadth, higher VIX readings, deteriorating sentiment, and falling momentum. Counting those as four independent warnings can exaggerate the amount of new information. A more useful framework groups indicators by the economic risks they measure.
The bear-market pillar develops the leverage and financial-stress mechanisms behind deeper downturns. The same vulnerabilities need not lead to the same outcome in every cycle.
Organizing Market Correction Warning Signs in a Dashboard
A market-risk dashboard organizes financial indicators into a consistent monitoring framework. Its purpose is to improve understanding, not to produce a guaranteed buy-or-sell signal. A practical dashboard can divide indicators into several categories.
| Risk category | Representative indicators | Main question |
|---|---|---|
| Valuation | Forward P/E, CAPE, equity risk premium | Are prices demanding relative to fundamentals? |
| Earnings | Earnings revisions, margins, guidance | Are profit expectations deteriorating? |
| Breadth | Advance-decline line, percentage above 200-day average | Is market participation weakening? |
| Credit | Corporate spreads, lending conditions | Is financing stress increasing? |
| Volatility | VIX, realized volatility | Is expected or actual price variability increasing? |
| Economic activity | Employment, new orders, real spending | Is growth weakening? |
| Leverage and liquidity | Margin exposure, funding stress, market depth | Could selling pressure be amplified? |
A dashboard of market correction warning signs should distinguish observed conditions from forecasts. For example, widening credit spreads are an observable market development. The claim that those spreads guarantee a 15% stock-market decline next month is a forecast requiring separate evidence.
Establish Consistent Measurement Periods
Indicators should be measured using comparable methods. A weekly breadth measure should not be casually compared with an annual valuation statistic without recognizing their different horizons. Historical percentiles can provide context. For example, a forward P/E ratio near the upper end of its historical distribution may indicate unusually demanding valuations. However, the historical comparison should account for data availability, accounting changes, and market composition.
Track Changes Rather Than Just Levels
An indicator’s direction can sometimes provide additional information. A credit spread that remains historically low but rises rapidly may deserve attention. An elevated valuation multiple declining alongside rising earnings estimates may have a different interpretation from one remaining elevated while earnings expectations weaken.
Explain the Limits of the Dashboard
Any scoring system requires judgment. Assigning numerical weights to indicators does not create reliable probabilities unless the methodology has been statistically validated. A professional educational dashboard should not claim that a particular score establishes a 70% probability of a market correction without rigorous evidence.
An Illustrative Market Vulnerability Score
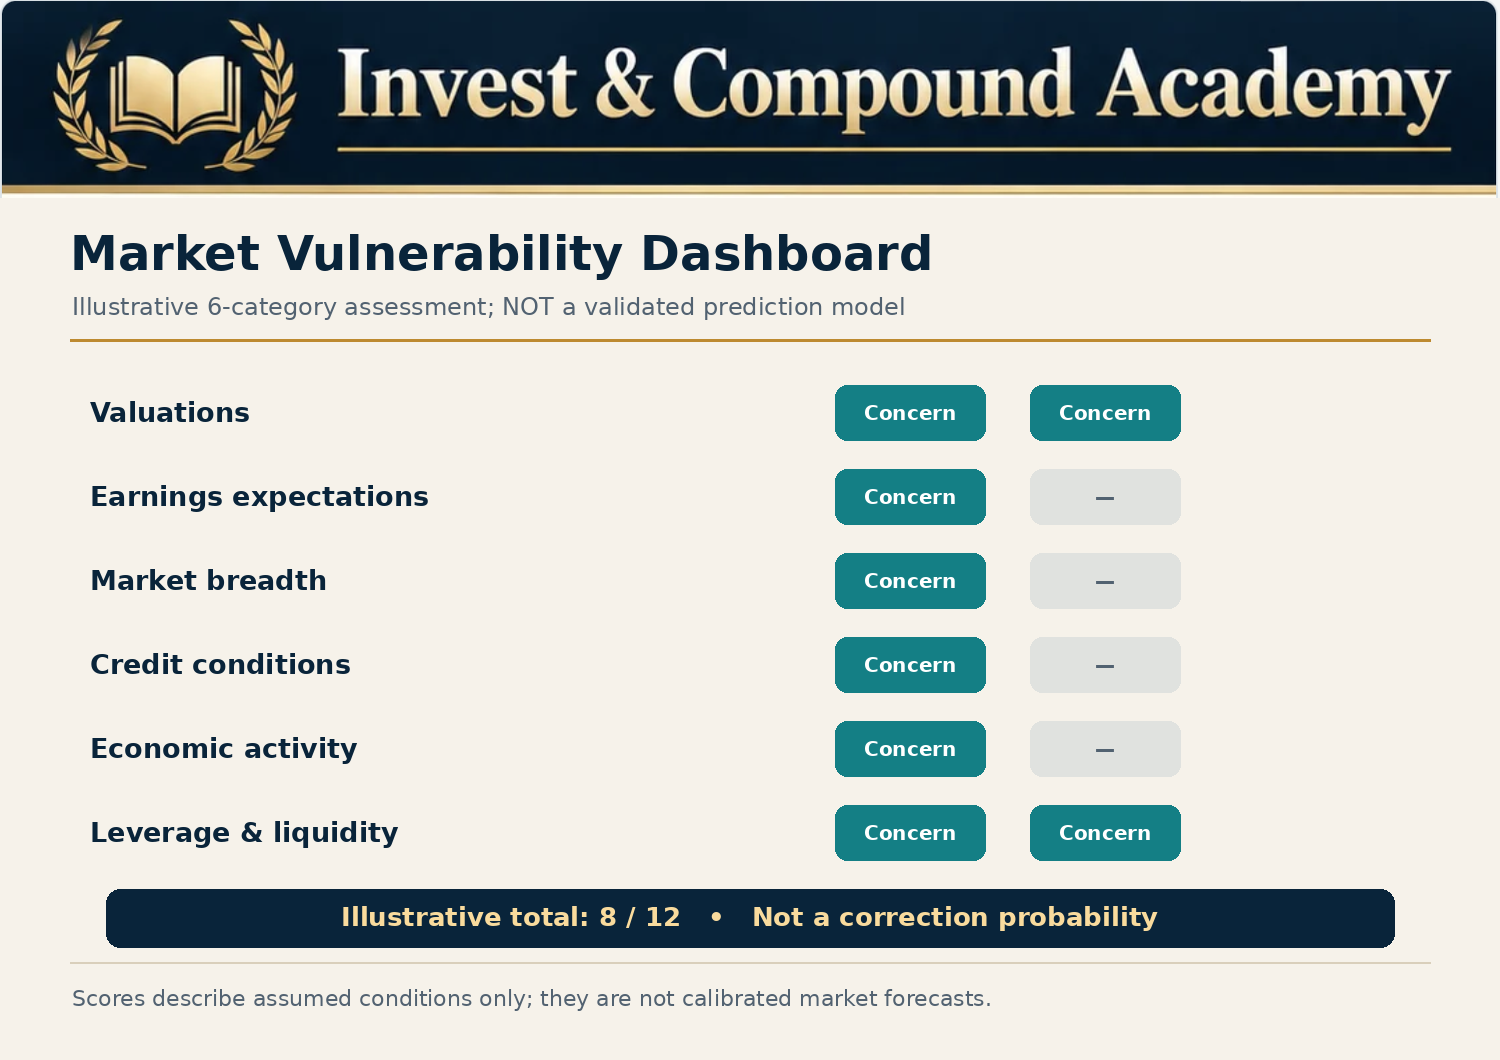
A simple scoring model can demonstrate how investors might organize information. Suppose a dashboard contains six analytical categories, which may overlap and should not be assumed statistically independent: valuations, earnings, breadth, credit, macroeconomic conditions, and leverage/liquidity. Each category receives an illustrative score from zero to two. Zero indicates relatively limited observed concern. One indicates a mixed or deteriorating condition. Two indicates substantial concern under the selected criteria. The total score ranges from zero to twelve. However, the resulting total should not be interpreted as a statistically validated probability of a market correction.
Example
| Category | Hypothetical assessment | Score |
|---|---|---|
| Valuations | Elevated | 2 |
| Earnings | Moderately weakening | 1 |
| Market breadth | Narrowing | 1 |
| Credit | Limited spread widening | 1 |
| Economic activity | Mixed | 1 |
| Leverage and liquidity | Substantial vulnerabilities | 2 |
| Total | Illustrative assessment only | 8/12 |
The score communicates that several vulnerabilities deserve attention. It does not establish when prices will decline. The dashboard can be more useful when each assessment includes the supporting observation, its date, and any limitations.
Why This Is Not a Trading System
A score of eight does not mean that stocks should automatically be sold. An investor with a well-diversified long-term portfolio and adequate liquidity may have no reason to make immediate changes. Another investor with substantial margin debt and concentrated exposures may need to review risk even when the score is much lower. The correct response depends on portfolio-specific consequences, not a universal dashboard threshold.
The categories have equal weights solely for illustration. There are no estimated correction probabilities, fitted thresholds, validated trading rules or live market readings in this score. The example is not an assessment of today’s market. Record the source, publication date and reason for every real-world observation.
How to Use Market Correction Warning Signs Responsibly
The practical value of market indicators lies in helping investors understand vulnerabilities before they become financially damaging. An investor does not need to predict a correction to improve risk management.
Review Asset Allocation
An extended market advance can cause equities to become a larger share of a portfolio than originally intended. Rebalancing may restore the desired allocation. However, changes should reflect established investment objectives rather than an attempt to forecast a particular trading day.
Evaluate Concentration
A portfolio can become heavily dependent on a small number of companies, sectors, or investment themes. Understanding underlying ETF holdings can reveal overlap.
Examine Liquidity Needs
Money needed for near-term expenses may not be suitable for substantial equity-market risk. Accessible reserves can reduce the likelihood of selling investments during a downturn.
Understand Margin and Debt Exposure
Leverage magnifies losses and introduces collateral requirements. A portfolio that appears manageable during low-volatility markets may be vulnerable when prices move rapidly.
Stress-Test Portfolio Losses
Consider a hypothetical $200,000 equity portfolio. A 10% loss reduces its value to $180,000. A 20% loss reduces it to $160,000. A 35% loss reduces it to $130,000. These scenarios are not forecasts. They help assess whether the financial consequences would be manageable.
Review Investment Fundamentals
For individual companies, examine debt obligations, earnings quality, cash flow, and competitive position. For ETFs, review underlying exposure, concentration, strategy, and fees.
Avoid Unnecessary Trading
Higher perceived risk does not automatically mean that repeatedly entering and exiting the market will improve results. Trading costs, taxes, and missed recoveries can materially affect outcomes.
For implementation, see what to do during a market correction and ETF rebalancing with whole shares. Those guides address portfolio decisions rather than forecasting a market turning point.
Why Market-Correction Predictions Frequently Fail
Market forecasters face several recurring difficulties.
Timing Error
An analyst may correctly identify high valuations but incorrectly predict when the market will decline. If prices continue rising for years, an early exit may be costly.
Magnitude Error
An analyst may correctly anticipate volatility but overestimate the severity of the decline. A forecast of a 30% crash may be followed by a brief 8% pullback.
Catalyst Error
Markets may decline for reasons different from those initially anticipated. A concern about inflation may prove less important than an unexpected geopolitical event.
False Positive Signals
Indicators can deteriorate without a market correction occurring. This can happen because businesses remain resilient, monetary conditions improve, or risks were already reflected in valuations.
False Negative Signals
A severe downturn can begin without an obvious combination of traditional warnings. Unexpected shocks may alter expectations abruptly.
Data Revisions and Availability
Economic data are sometimes revised after publication. Historical backtests may also use information that was not available to investors at the time. A realistic assessment of indicator performance must consider what could actually have been known before the event.
Overfitting
Researchers can construct models that explain historical corrections unusually well by selecting parameters after examining past outcomes. Such models may perform poorly on new data. A credible indicator framework needs out-of-sample testing, realistic transaction costs, transparent assumptions, and clear limitations.
Historical Lessons From Major Market Episodes
Several historical events show why indicators must be understood in context.
The 2000–2002 Technology Collapse
Valuations among many technology-related companies had become exceptionally demanding. When growth expectations deteriorated, share prices fell substantially. This period demonstrates that valuation excesses can contribute to severe market losses. However, high valuations were visible before the final market peak. Their existence did not provide an exact trading date.
The 2007–2009 Financial Crisis
Credit deterioration, leverage, and financial-system vulnerabilities became central to the crisis. The event demonstrates why credit markets and funding conditions deserve attention alongside equity valuations. It also illustrates how financial stress can spread through interconnected institutions.
The 2018 Market Declines
Changes in interest-rate expectations, trade concerns, and growth uncertainty contributed to significant volatility. The episode shows that equity valuations can respond sharply to changing financial conditions without a corresponding banking-system collapse.
The 2020 Pandemic Collapse
The pandemic produced an exceptionally rapid market decline. Traditional valuation or breadth indicators could not reliably predict the timing and scale of the public-health shock. The episode demonstrates the limitations of expecting known indicators to identify every future crisis.
The 2022 Bear Market
Inflation and tighter monetary policy contributed to pressure on equity and bond valuations. The episode underscores the need to understand interest-rate exposure across multiple asset classes.
The Broader Lesson
Historical downturns have different causes. An indicator particularly useful for analyzing one financial environment may provide limited information in another. A diversified risk framework is generally more informative than relying on one favored warning signal.
Study the episodes and measurement conventions in the biggest market corrections in stock market history. For the separate recovery question, see how long market corrections last. A history of earlier declines does not validate a prediction model.
What Warning Signs Mean for ETF Investors
ETF investors should evaluate both broad market risk and the specific characteristics of the funds they own. A diversified S&P 500 ETF remains exposed to broad equity-market declines. A concentrated growth ETF may have greater sensitivity to valuation compression. A high-yield corporate bond ETF may be exposed to widening credit spreads. A long-duration Treasury ETF can experience significant losses when interest rates rise.
Overlapping Holdings
Owning several ETFs does not guarantee meaningful diversification. Funds may hold substantial positions in the same companies. A portfolio containing several large-cap growth funds could be vulnerable to the same valuation or earnings shock.
Covered-Call ETFs
Covered-call strategies may generate option income, but they do not eliminate downside risk. An increase in volatility can affect option premiums, although the actual consequences depend on strike selection, maturity, underlying exposure, and strategy structure. A high distribution yield should not be interpreted as evidence of protection against a correction.
Dividend ETFs
Dividend-paying companies can experience significant losses when earnings expectations weaken. The sustainability of distributions depends on underlying business conditions. Income-oriented investors should evaluate total return and financial risk rather than assume that regular payments guarantee stability.
Bond ETFs
Bond funds respond to interest rates and credit conditions. Treasury yields, duration, and credit spreads can help investors understand different fixed-income risks. However, there is no guarantee that bonds will appreciate whenever equities decline.
Our VOO and VTI overlap analysis demonstrates why several fund tickers can still leave a portfolio exposed to many of the same companies. The ETF portfolio construction guide connects exposure with allocation choices.
The Difference Between a Warning Sign and a Reason to Sell
An indicator can reveal greater market vulnerability without creating an appropriate reason for every investor to sell. Suppose valuations are elevated and market breadth has weakened. An investor with twenty-five years until retirement, adequate emergency savings, no leverage, and a suitable diversified portfolio may reasonably maintain an established contribution plan. Another investor holding an extremely concentrated leveraged portfolio may have a much stronger reason to reduce risk. The market indicators are identical. The portfolio consequences differ.
The SEC’s investor education guidance emphasizes that asset allocation and rebalancing should reflect investment horizons, financial goals, and risk tolerance. This is a more durable foundation than responding automatically to a warning signal.
When Portfolio Changes May Be Justified
A reduction in risk may be appropriate when the portfolio no longer matches the investor’s financial circumstances. Examples include an approaching spending obligation, excessive concentration, unsustainable leverage, or deteriorating investment fundamentals. These decisions do not require the investor to know whether the market will fall next week.
When Holding May Be Appropriate
Maintaining exposure may be reasonable when the investor’s time horizon, liquidity, diversification, and underlying investment objectives remain unchanged. The investor should still understand the possibility of further losses. Discipline means following a suitable plan, not refusing to respond to meaningful changes.
If the question is deploying new cash, continue with whether to buy stocks during a market correction. A purchase decision requires valuation and liquidity analysis as well as an assessment of market risk.
Frequently Asked Questions
What Are the Main Market Correction Warning Signs?
Potential warning signs include elevated valuations, deteriorating market breadth, weaker corporate earnings estimates, widening credit spreads, rising volatility, tighter financial conditions, and increasing leverage-related vulnerabilities. None guarantees that a correction will occur.
Can the VIX Predict a Market Correction?
No. The VIX reflects expected S&P 500 volatility over approximately 30 days, not the direction of future stock prices. It can rise after selling has already begun.
Does a High P/E Ratio Mean Stocks Will Fall?
Not necessarily. Elevated valuations can increase sensitivity to disappointment, but markets can remain expensive for extended periods.
What Is Market Breadth?
Market breadth measures how widely gains and losses are distributed across individual securities. Weak breadth can indicate narrow market leadership but does not reliably predict a correction.
Why Do Credit Spreads Matter?
Widening credit spreads may indicate rising credit or liquidity concerns. These developments can affect corporate financing and economic activity.
Does an Inverted Yield Curve Predict a Market Crash?
No. Selected yield-curve inversions have historically been associated with elevated recession risk, but they do not reliably predict the timing or magnitude of stock-market corrections.
Can Strong Earnings Prevent a Correction?
Strong earnings can support valuations, but prices also depend on expectations, interest rates, and investor risk preferences. Stocks can decline even while profits grow.
Is High Investor Optimism Dangerous?
Extreme optimism may accompany elevated valuations or speculative positioning, but optimistic sentiment can persist for long periods without an immediate decline.
Can a Correction Occur Without Any Warning?
Unexpected shocks can trigger rapid repricing, even when conventional indicators were not displaying extreme vulnerability.
Should Investors Sell When Several Indicators Turn Negative?
Not automatically. Decisions should depend on investment horizon, financial obligations, portfolio concentration, leverage, and the investor’s risk capacity.
Are Technical Indicators Better Than Economic Indicators?
They measure different relationships. Technical indicators describe price and trading behavior, while economic indicators provide information about business and financial conditions. Neither category reliably predicts every correction.
Can Moving Averages Predict a Bear Market?
Moving averages can describe changes in price trends, but they are backward-looking calculations and can produce false signals.
What Does a Widening High-Yield Spread Suggest?
It may indicate that investors demand greater compensation for credit or liquidity risk. However, the widening does not establish that equity prices must decline.
How Does Leverage Increase Correction Risk?
Leverage magnifies losses and can create margin calls or forced selling. These mechanisms may amplify market stress.
Is There a Reliable Market Correction Probability Calculator?
A credible probability model requires a clearly defined forecast horizon, historical data, robust statistical testing, and transparent assumptions. A simple indicator score does not establish a validated probability.
How Often Should Investors Monitor Indicators?
The appropriate frequency depends on the investment strategy. Long-term investors may benefit more from periodic portfolio reviews than reacting to every daily data point.
Can Investors Avoid Every Correction?
There is no demonstrated method that consistently identifies and avoids every market correction while also reliably capturing subsequent recoveries.
What Is the Most Important Warning Sign?
There is no universally superior indicator. The interaction between valuations, earnings, credit conditions, liquidity, and leverage can be more informative than one measure alone.
Using Market Correction Warning Signs Without Overreacting
Investors naturally want to recognize a market correction before it happens. The desire is understandable. Avoiding a significant decline while participating in the subsequent recovery would produce an attractive investment outcome. However, successfully executing that strategy requires decisions under substantial uncertainty. Valuation measures can reveal how much optimism is reflected in stock prices. Market breadth can show whether an index advance is becoming increasingly concentrated. Earnings revisions provide information about changing corporate expectations. Credit spreads and funding conditions can reveal financial stress. Volatility measures indicate changing expectations about the range of market movements.
Economic indicators help assess the broader business environment, while leverage and liquidity reveal mechanisms that can amplify losses. Market correction warning signs contribute different kinds of information. None provides certainty. The most important distinction is between identifying conditions that make a market more vulnerable and claiming to know when prices will decline. Historical market corrections have emerged from different combinations of economic, financial, and geopolitical developments. Some occurred after visible valuation excesses. Others were triggered by unexpected events that conventional indicators could not reliably anticipate. The practical value of monitoring warning signs is therefore not the promise of perfect timing.
It is the opportunity to evaluate risk before unfavorable conditions expose weaknesses in a financial plan. Investors can assess portfolio concentration, maintain liquidity appropriate to upcoming obligations, understand the consequences of leverage, and ensure that investment allocations reflect their objectives and capacity to absorb losses. These actions can remain valuable even when an anticipated correction never occurs. An investor who reduces excessive concentration has addressed a genuine financial vulnerability, regardless of the market’s next movement. An investor who avoids unsustainable borrowing has improved financial resilience without needing to forecast a crisis.
An investor who maintains a suitable diversified strategy may be better prepared to withstand volatility than someone repeatedly reacting to uncertain predictions. Market indicators should inform judgment rather than replace it. The strongest approach to a potential market correction is not to claim certainty about when it will begin. It is to understand where risk is accumulating and ensure that the investment strategy remains financially viable if that risk materializes.
Continue Learning in the Invest & Compound Academy
Connect market indicators with the definitions, historical evidence and portfolio decision guides in this series.
Market risk, indexes and portfolio strategy
Market Correction Pillar | Indexes and Markets | Portfolio Construction
Sources and Further Reading
Reference review: October 18, 2026. The May 2026 report supplies a dated conceptual framework, not a claim about current market readings. All numerical examples, graphics, calculators and dashboard assessments in this article are hypothetical. The dashboard is an Academy illustration and is not endorsed or validated by the cited institutions.
- Federal Reserve: May 2026 Financial Stability Report, Purpose and Framework. Shocks versus vulnerabilities.
- Federal Reserve: May 2026 report, Asset Valuations. Valuation pressures and financial-market measures.
- Federal Reserve: May 2026 report, Leverage in the Financial Sector.
- Cboe: What the VIX and VIX1D Indices Attempt to Measure and How They Differ.
- Cboe: VIX Frequently Asked Questions. Index interpretation and methodology.
- SEC Investor.gov: Asset Allocation and Diversification.
- SEC Investor.gov: Beginners’ Guide to Asset Allocation, Diversification, and Rebalancing.
- FRED / ICE Data Indices: U.S. High Yield Index Option-Adjusted Spread. Series definition, units and licensing; no live series values are reproduced here.
This article provides general financial education and information. It is not personalized investment, financial, legal or tax advice or a recommendation to buy, sell or hold a security.
Indicators may reveal vulnerabilities without predicting the direction, timing or severity of market movements. The illustrative score does not estimate a correction probability. Calculators simplify the relationships described alongside them. Fees, taxes, liquidity, leverage and cash flows can affect real outcomes. Investments can lose principal, and past performance does not guarantee future results. Evaluate your circumstances and consult qualified professionals where appropriate.