Bond Yield Explained: Coupon, Current Yield and Yield to Maturity
Learn why coupon and yield can tell different stories, with practical examples of purchase price, maturity repayment and early redemption.
By Greg Roman · Educational guide · Original hypothetical examples in USD

Bond yield explained in practical terms starts with three measures: coupon rate, current yield and yield to maturity. Each uses a different relationship between payment terms and purchase price.
Two bonds can display the same coupon and offer different investment returns. A bond with a larger coupon can be less attractive than one paying less interest each year. These statements make sense once you separate the payment contract from the price paid for it.
Bond yield is a way of relating cash flows to investment cost and time. The difficulty is that several measures use the word yield. A coupon rate, current yield and yield to maturity do not include the same information. Comparing them as if they were equivalent can produce a misleading decision.
This guide explains what the main figures measure, walks through original examples and shows how to read a quote without letting the largest percentage dominate the review. Examples use hypothetical USD amounts. They are not current offers, and they exclude taxes, fees and accrued interest unless a section explicitly discusses them.
Coupon rate describes the contractual interest
For a conventional fixed-rate bond, the coupon rate determines annual interest relative to face value. A $1,000 bond with a 5% coupon promises $50 per year according to its payment terms, assuming the issuer meets its obligations.
That $50 does not automatically change when the bond’s market price changes. A buyer paying $900 and another paying $1,100 can receive the same coupon dollars. The buyers have different starting costs, so they do not have the same economic return.
Frequency is separate from the annual rate. Semiannual payments would normally divide the $50 into two $25 installments. A quote of 5% does not mean receiving 5% twice a year.
Floating-rate bonds use a different arrangement: their interest rate resets under a specified formula. Zero-coupon bonds do not make periodic coupon payments. These structures require their own calculations, so the fixed-rate example should not be stretched to cover every debt instrument.
Current yield connects coupon dollars with price
Current yield equals annual coupon dollars divided by the bond’s market price. It answers a narrow question: how large is the annual contractual income relative to this price?
| Annual coupon dollars | Purchase price | Current yield |
|---|---|---|
| $50 | $900 | 5.56% |
| $50 | $1,000 | 5.00% |
| $50 | $1,100 | 4.55% |
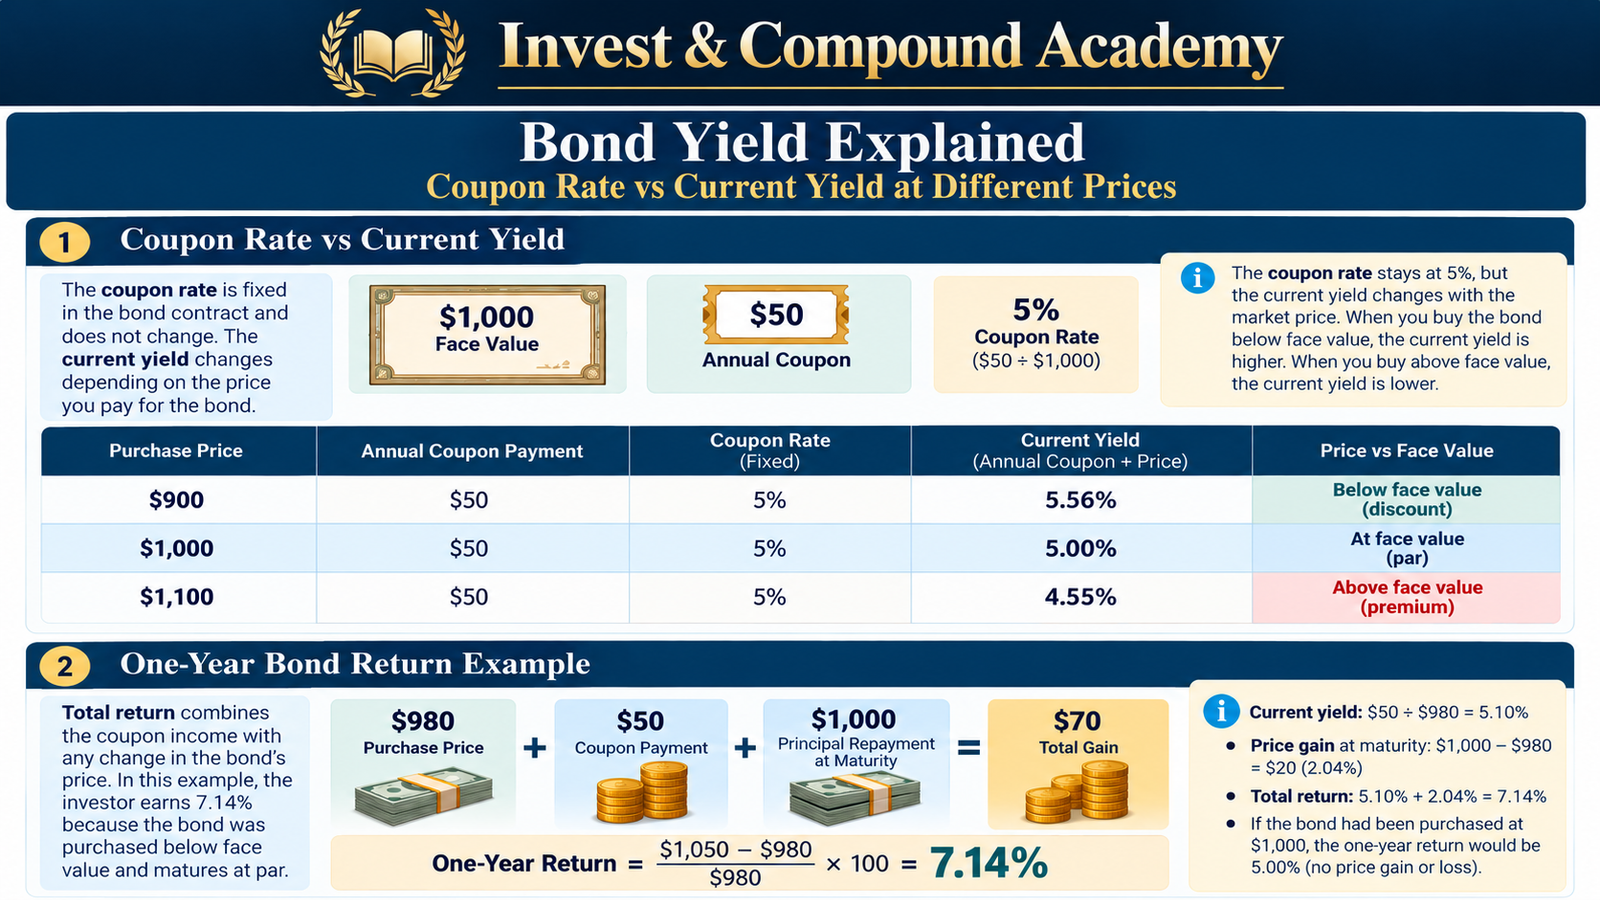
The bond’s fixed coupon rate is still 5% in every row. The changing denominator creates the changing current yield. This is useful for describing income relative to price, but it leaves out the principal amount returned at maturity.
For the $1,100 buyer, a $1,000 maturity payment represents $100 less principal than the purchase price. For the $900 buyer, it represents $100 more. Current yield does not capture either adjustment.
It also does not account for the timing of coupons beyond the annual amount, reinvestment or a future sale price. Treat it as one view of the investment rather than a complete summary of expected return.
Yield to maturity includes the scheduled repayment
Yield to maturity, often shortened to YTM, is the discount rate that makes the present value of scheduled coupon and principal payments equal the bond’s price. It brings the timing of cash flows into the calculation.
In practical terms, it considers the purchase price, coupon payments, remaining time and principal repayment. A discount bond’s scheduled gain toward face value can increase YTM relative to current yield. A premium bond’s scheduled reduction toward face value can lower it.
YTM assumes the scheduled payments occur. It is not an insurance policy against default. It also does not automatically include brokerage costs or the investor’s tax treatment. Market conventions can differ in payment frequency and annualization, so compare figures calculated on compatible bases.
There is a further distinction between a cash-flow discount rate and accumulated wealth. Achieving a compounded terminal return at that rate requires coupons to be reinvested consistently with the assumptions. Actual reinvestment opportunities can differ. That is why a quoted YTM should not be described as a guaranteed annual account gain.
A one-year example makes the distinction visible
Consider a fictional bond with one year remaining, a single $50 coupon payable at maturity and $1,000 principal also payable then. There are no intervening payments. Assume no default and ignore all costs.
At a purchase price of $980, the final cash flow is $1,050. The one-year return is $70 divided by $980, or approximately 7.14%. Current yield is only $50 divided by $980, or 5.10%.
At a $1,020 price, the same final cash flow creates a $30 gain. The one-year return is approximately 2.94%, while current yield is approximately 4.90%. The coupon rate remains 5%.
Because there is only one payment date, no coupon reinvestment is needed in this example. It demonstrates cleanly why a premium or discount changes the economic result. Longer bonds with multiple payment dates require a more involved calculation.

Do not annualize by simply dividing every gain
Suppose an investment grows from $1,000 to $1,210 over two years with no intermediate payments. The cumulative return is 21%. Dividing by two gives a simple average of 10.5%, but the compound annual growth rate is 10% because $1,000 multiplied by 1.10 twice equals $1,210.
A coupon bond adds another layer because cash arrives at different times. The yield calculation accounts for those dates rather than treating all dollars as if they arrived at the end.
When comparing a broker’s quoted yield with your own calculation, check whether you are using a cumulative return, simple annual average or cash-flow-based annualized measure. Each can be useful when labeled correctly. They should not be mixed in one comparison table without explanation.
The same discipline applies to short-term securities. An annualized quotation describes a convention; it does not mean a three-month investment pays the displayed annual percentage over three months.
Yield to call addresses early redemption
A callable bond gives the issuer specified rights to redeem debt before the stated maturity. The call dates, conditions and repayment price come from the security’s terms.
Yield to call uses a relevant call date and call price instead of the final maturity date and principal payment. This can matter when an investor pays a premium for a high-coupon bond that the issuer could redeem earlier.
Imagine paying $1,060 for a fictional bond that can be redeemed for $1,000 in one year after a $60 coupon. If redemption occurs exactly under those assumptions, the total received is $1,060. The one-year gain before costs is zero, even though the coupon rate sounds appealing.
The example is intentionally simple and does not predict an issuer’s behavior. It shows why an attractive coupon cannot substitute for examining call terms. Different call dates or redemption prices create different results.
Yield to worst does not mean the worst possible loss
Yield to worst commonly identifies the lowest relevant quoted yield across contractual redemption scenarios, such as maturity and applicable call dates. It helps compare outcomes if payments occur under those scenarios.
The name can be misleading for beginners. It does not include every possible disaster. Default, restructuring, an emergency sale, currency movement or unexpected costs can produce outcomes worse than a quoted yield-to-worst figure.
Treat it as a contractual scenario measure, not a floor under investment performance. Read which redemption dates the calculation considers and whether unusual features require further analysis.
This distinction is particularly useful when an investment advertisement emphasizes a high coupon. Ask for maturity yield, applicable call yields and the assumptions behind the displayed number. If the quote omits a material feature, the comparison remains incomplete.
Price quotes and accrued interest affect the bill
Bond prices are often expressed as a percentage of face value. A quote of 98 normally means 98% of par: $980 for $1,000 face value before other applicable amounts. A quote of 104 means $1,040 on that same face value.
Many secondary-market coupon bonds settle with accrued interest added to the quoted clean price. The buyer compensates the seller for interest accrued since the last payment date, then receives the next scheduled coupon under the applicable terms.
That next coupon is therefore not always entirely new income attributable to the buyer’s holding period. Part may correspond to accrued interest paid at purchase. Exact calculations depend on settlement date, day-count convention and security terms.
Ask for the total settlement amount before placing an order. Clean price, accrued interest and transaction charges are different components. Knowing only the displayed price and coupon can leave the actual cash requirement unclear.
Fees can change a small yield advantage
Suppose two otherwise comparable opportunities differ by only $15 in expected annual cash benefit on the amount you plan to invest. If one requires meaningfully higher trading costs, that difference may disappear.
Individual bond transactions can involve commissions or dealer markups and markdowns. Fund shares have their own trading costs, while the fund’s expense ratio affects assets and returns over time. The appropriate comparison depends on the structure.
Calculate using your transaction size rather than assuming that an institutional quote applies to a small purchase. A price available for one order quantity may differ from the price for another.
Tax treatment can also change usable income, but it depends on jurisdiction, account and security. This guide does not apply a universal tax rate. Keep a separate line for the questions that require current guidance relevant to your circumstances.
Yield is not a substitute for credit analysis
A higher yield can reflect the market’s demand for compensation for greater risk. Before celebrating the extra percentage, identify the issuer’s obligations, financial condition and the bond’s priority and security.
Two bonds with the same maturity can have different default risks. Two bonds from the same company can also differ in repayment priority or call features. Their yield difference may be economically meaningful rather than a free improvement.
The useful comparison begins with compatible instruments. Match currencies, payment schedules, maturity exposure and important contractual features as far as possible. Then examine why the market values the remaining differences.
A yield quote estimates or summarizes compensation under a set of assumptions. It does not tell you how comfortable you will be if the assumptions fail. That judgment needs the rest of the investment review.
Bond fund yields need their own definitions
A bond ETF may display distribution yield, a standardized yield measure, portfolio yield to maturity and other figures. These are not necessarily interchangeable with the YTM of one directly owned bond.
Distribution yield usually relates distributions over a stated period or annualized recent payment to share price. It can be influenced by the measurement window and distribution policy. It does not automatically forecast the next twelve months of payments.
A U.S. fund’s 30-day SEC yield is a standardized income measure with a specified calculation period and methodology. Portfolio YTM summarizes underlying holdings under its stated approach. Fund expenses, trading, changing holdings and the absence of one shareholder maturity date affect how these measures translate into realized returns.
Read the footnote next to every yield figure. The definition, date and calculation basis matter more than whether the number appears prominently on a factsheet. This is a central skill we will revisit in the ETF factsheet guide.
Build a comparison worksheet that makes sense

Create columns for issuer, currency, face value, price, total settlement amount, coupon schedule, maturity, call provisions and the relevant yield measures. Add costs and a short description of the credit exposure.
Use the same date for competing quotes where possible. Markets move, and a stale quote beside a current one can create a false difference. Record the source and whether the quote is indicative or executable for your order size.
Then write a plain-language conclusion. For example: this premium bond provides larger coupon dollars, but its scheduled principal repayment is below purchase cost and its call terms reduce the relevant yield. That sentence explains more than highlighting the largest rate in green.
Finally, connect the comparison with your intended holding period. If you expect to sell early, YTM alone cannot predict the sale price. If you intend to hold to maturity, you still need to assess payment reliability and reinvestment assumptions.
Common questions about bond yield
Is the coupon my annual return?
Only in limited circumstances can the figures coincide. Purchase price, principal repayment, costs, sale timing and reinvestment affect the overall result.
Can current yield rise because my bond lost value?
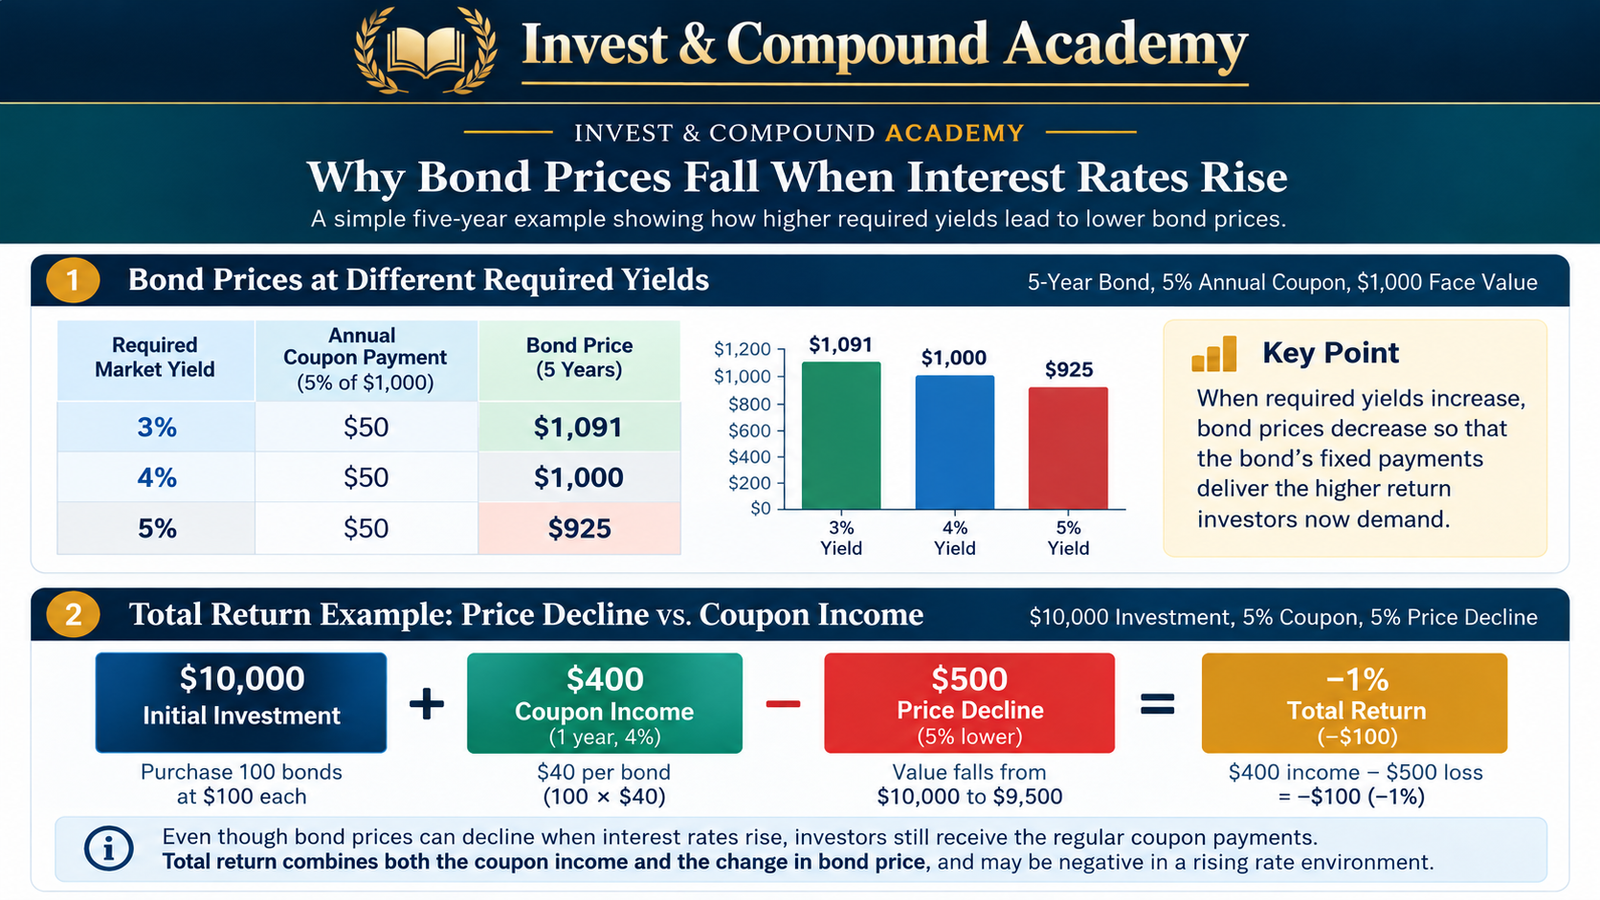
Yes. If coupon dollars are unchanged and market price falls, current yield rises mathematically. That does not itself reverse the existing owner’s loss.
Is yield to maturity guaranteed?
No. It assumes scheduled payments and uses specific calculation conventions. Realized outcomes can differ because of default, costs, taxes, reinvestment and the investor’s actions.
Should I always choose the highest yield?
No. Compare risks, cash-flow dates and terms before ranking percentages. A higher number may be compensation for an exposure that does not fit your goal.
Read the definition before the number
The most useful habit in bond analysis is simple: ask what a displayed yield includes and what it leaves out. Coupon, current yield and maturity yield offer different views of the same security.
Once you understand those views, a quote becomes easier to interpret. You can compare promised income with purchase cost, recognize the effect of a premium or discount and ask whether the payment schedule serves the intended purpose. The number becomes part of the decision rather than the entire decision.
Educational information only. All examples are hypothetical. Investing involves risk, including loss of principal.
Bond yield explained: One-year single-payment yield exercise
Exactly one year to a single coupon and principal payment. No other payments, default, call, accrued interest, costs or taxes. Not a general multi-year YTM calculator.
Continue Learning in the Invest & Compound Academy
Build on these bond-pricing concepts with related research guides.
Bonds, rates and fixed income
How bonds work Bond prices and rates Bond yield Government vs corporate Bond ETFs vs bonds Bond ladders Best bond ETFs
Sources and Further Reading
Primary educational references support the concepts. Numerical scenarios and worksheets are original hypothetical examples, not current quotes or forecasts.