Commodity ETFs
Six core funds comparedA research hub for commodity ETFs and commodity ETF comparisons: DBC, PDBC, GSG, USCI, BCI and COMT. This page shows what each fund holds, what it costs, what tax form it issues and how much of its exposure it shares with the others. Every comparison page carries dated figures and sources.
Fund data from Invesco, iShares, USCF and abrdn pages and index provider publications, Sep 30 to Nov 9, 2026 · Educational research, not advice
Commodity ETFs at a glance
Six things to know first- Futures, not physical goods. These funds hold futures contracts and Treasury collateral, so returns include roll yield and interest, not just price.
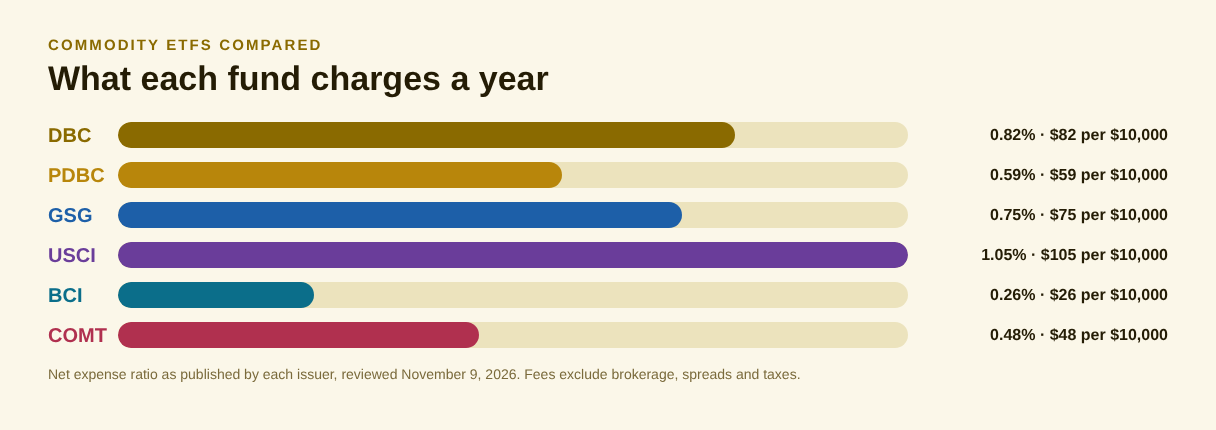
- Cost range. Expense ratios run from 0.26% to 1.05%, which is $790 a year on $100,000.
- Tax form. DBC, GSG and USCI issue a Schedule K-1. PDBC, BCI and COMT issue a 1099.
- Oil-heavy. Energy is 52% to 57% of four of the six funds and 39% of BCI and 34% of USCI.
- Heavy overlap. Pairs share 42% to 96% of their exposure by commodity.
- Volatile. One-year NAV returns ran from 40% to 55% on the dates shown. Commodities can fall as fast as they rise.
Core commodity ETFs, the six funds side by side
Dated figures, sources on each comparison| DBC | PDBC | GSG | USCI | BCI | COMT | |
|---|---|---|---|---|---|---|
| Fund | Invesco DB Commodity Index Tracking Fund | Invesco Optimum Yield Diversified Commodity Strategy No K-1 ETF | iShares S&P GSCI Commodity-Indexed Trust | United States Commodity Index Fund | abrdn Bloomberg All Commodity Strategy K-1 Free ETF | iShares GSCI Commodity Dynamic Roll Strategy ETF |
| Approach | Futures on 27 commodities, index | Futures on 27 commodities, active | One S&P GSCI future plus T-bills | 14 futures chosen by rule each year | Bloomberg index, capped weights | GSCI futures with a dynamic roll |
| Index | DBIQ Optimum Yield Diversified Commodity Index Excess Return | DBIQ Optimum Yield Diversified Commodity Index Excess Return (benchmark) | S&P GSCI Total Return Index | SummerHaven Dynamic Commodity Index Total Return | Bloomberg Commodity Index Total Return | S&P GSCI Dynamic Roll Index |
| Expense ratio | 0.82% | 0.59% | 0.75% | 1.05% | 0.26% | 0.48% |
| Tax form | Schedule K-1 | 1099 | Schedule K-1 | Schedule K-1 | 1099 | 1099 |
| Commodities covered | 27 | 27 | 24 | 14 | 25 | 24 |
| Energy share of exposure | 53% | 57% | 52% | 34% | 39% | 56% |
| Ten largest commodities | 75.6% | 77.3% | 75.4% | 73.1% | 66.6% | 80.6% |
| Net assets | $1.77B (Nov 9) | $7.4B (Nov 9) | $961.7M (Nov 9) | $401.0M (Nov 9) | $3.28B (Nov 9) | $1.29B (Nov 9) |
| Launched | 2006 | 2014 | 2006 | 2010 | 2017 | 2014 |
Dates differ by issuer and are shown on each comparison page. Energy share is each fund’s weight in energy futures, computed from issuer holdings or published index weights. GSG and BCI do not publish commodity weights, so reference weights are used, as the method section explains. Net assets are issuer figures dated Nov 9, 2026.
BCI is the lowest-cost fund at 0.26%. USCI is the most expensive at 1.05%. Fees matter, but so do the tax form and the commodity mix, which differ far more than the fees do.
Commodity ETFs, fund by fund
What each one is and where it differsDBC
Invesco DB Commodity Index Tracking Fund follows the DBIQ Optimum Yield Diversified Commodity Index and holds futures on 27 commodities, with the rest in Treasury bills and cash. It charges 0.82% and had $1.77B on Nov 9, 2026. It files a Schedule K-1.
PDBC
Invesco Optimum Yield Diversified Commodity Strategy No K-1 ETF uses the same 27-commodity universe as DBC but is actively managed, with Treasury securities and swaps alongside futures. It charges 0.59% and had $7.4B on Nov 9, 2026. It issues a 1099.
GSG
iShares S&P GSCI Commodity-Indexed Trust holds one S&P GSCI futures contract plus Treasury bills. It charges 0.75% and had $961.7M on Nov 9, 2026. The index weights commodities by world production, so energy is more than half. It files a Schedule K-1.
USCI
United States Commodity Index Fund follows the SummerHaven Dynamic Commodity Index and holds 14 futures contracts picked by rules each year. It charges 1.05% and had $401.0M on Nov 9, 2026. Its mix is far less oil-heavy than the others. It files a Schedule K-1.
BCI
abrdn Bloomberg All Commodity Strategy K-1 Free ETF follows the Bloomberg Commodity Index, which caps any one commodity and sector. It charges 0.26% and had $3.28B on Nov 9, 2026. It issues a 1099 and has the lowest fee here.
COMT
iShares GSCI Commodity Dynamic Roll Strategy ETF follows the S&P GSCI Dynamic Roll Index, which holds the GSCI mix but chooses contract months by roll yield. It charges 0.48% net and had $1.29B on Nov 9, 2026. It issues a 1099.
Commodity ETFs, what they hold and what they leave out
Futures, not barrels or barsNone of these funds stores oil in tanks or grain in silos. Each holds futures contracts, which are agreements to buy or sell a commodity on a set date, and keeps the rest of its money in Treasury bills, cash or similar holdings that back the contracts. A futures fund earns three things: the change in commodity prices, the roll yield or roll cost when it replaces an expiring contract with a later one, and interest on the collateral. That is why a commodity fund can differ from the price of oil or copper itself.
Production-weighted funds, GSG and COMT, follow the S&P GSCI, which sizes each commodity by how much the world produces. Crude oil and fuels dominate that index, so energy was 56% of COMT and 52% of GSG in the data used here. DBC and PDBC pick a smaller set of 27 commodities and favor contracts with the best expected roll yield, which still leaves energy at 53% and 57%.
BCI follows the Bloomberg Commodity Index, which limits how much one commodity or sector can weigh. Energy is 39% of BCI against 57% for PDBC, and gold, farm products and metals take a larger share. USCI goes further: it chooses 14 commodities each year using price trends, so its energy weight was 34% and industrial metals were 29%.
When DBC or PDBC fits: you want a broad 27-commodity basket with an index or an active roll. When GSG or COMT fits: you want production-weighted exposure that tracks the world economy, with COMT adding a roll rule. When BCI fits: you want capped weights and a 1099 at the lowest fee. When USCI fits: you want a different mix and accept a higher fee. These describe what the funds hold, not recommendations.
Commodity index rules, why similar funds differ
Why the funds hold different commoditiesEvery commodity fund has to answer three questions: which commodities count, how much of each to hold, and which contract month to own. The S&P GSCI weights by production, so a large oil market means a large oil weight. The Bloomberg Commodity Index weights by liquidity and production but caps any sector, so oil cannot take over. The DBIQ index picks the contract with the best roll yield among those it can hold. The SummerHaven index ranks commodities by momentum and carry and holds the top 14.
The effect on sector mix is large. Energy ran from 34% of USCI to 57% of PDBC. Agriculture ran from 14% of COMT to 29% of BCI, and precious metals from 8% of GSG to 14% of BCI. That is why overlap between the funds ranges from 42% to 96%, and why the choice of fund changes what you own.
The roll matters too. When later contracts cost more than the near one, called contango, rolling costs money. When they cost less, called backwardation, rolling earns money. COMT and the DBIQ-based funds try to pick contract months that lower the cost of the roll, while GSG holds one near-month index contract and takes whatever the market gives.
| Fund | Largest sector groups | Weights dated |
|---|---|---|
| DBC | Energy 52.9%, Agriculture 16.9%, Industrial metals 11.8% | Nov 9, 2026 |
| PDBC | Energy 56.7%, Agriculture 16.0%, Industrial metals 10.8% | Oct 31, 2026 |
| GSG | Energy 51.8%, Agriculture 17.0%, Industrial metals 12.1% | Jan 2026 index weights |
| USCI | Energy 34.0%, Industrial metals 29.2%, Agriculture 21.9% | Nov 9, 2026 |
| BCI | Energy 38.9%, Agriculture 29.1%, Precious metals 14.0% | Oct 31, 2026 sectors |
| COMT | Energy 56.0%, Agriculture 14.0%, Industrial metals 12.7% | Nov 9, 2026 |
Sector groups use one scheme for every fund, so they are comparable across funds but will not match each issuer’s own table. Livestock is shown separately. Treasury bills, cash and collateral are left out. GSG weights are S&P GSCI 2026 reference weights and BCI weights are Bloomberg 2026 targets scaled to abrdn’s sector weights.
Commodity ETF returns, issuer NAV figures
Annualized total return, dates shownIssuers report returns to different month-ends, so this table uses each issuer’s own NAV total return and shows the date in the last column. DBC and PDBC are dated Oct 31, 2026 and the other four Sep 30, 2026. Because the dates differ, compare the shape of each row rather than the decimals, and use each comparison page when you want a like-for-like pair.
| Fund | 1 year | 3 years | 5 years | 10 years | Returns to |
|---|---|---|---|---|---|
| DBC | 52.50% | 16.35% | 12.67% | 10.32% | Oct 31, 2026 |
| PDBC | 53.50% | 15.74% | 12.45% | 10.00% | Oct 31, 2026 |
| GSG | 55.21% | 16.40% | 16.09% | 9.16% | Sep 30, 2026 |
| USCI | 40.67% | Not captured | 21.73% | 10.19% | Sep 30, 2026 |
| BCI | 39.78% | 15.15% | 10.63% | Not captured | Sep 30, 2026 |
| COMT | 48.38% | 14.56% | 13.55% | 9.63% | Sep 30, 2026 |
Source: issuer fund pages (Invesco, iShares, USCF and abrdn). NAV returns are net of fund expenses. USCI does not show a 3-year figure on the page we used and BCI launched in 2017, so it has no 10-year figure; both are marked Not captured. Past performance does not guarantee future results.
Over the last year the funds ranged from 39.78% for BCI to 55.21% for GSG, a huge move for a diversified fund and a reminder that commodities swing. Over 10 years the numbers are much closer, between 9.16% and 10.32% a year where reported. Commodity returns arrive in bursts tied to supply shocks, so a strong year is not a forecast.
Read how to measure investment growth for how annualized returns work, and nominal vs real values for why commodities are often discussed as an inflation hedge.
Commodity ETF yield and distributions
What these funds pay, and what they do notCommodities have no earnings or dividends. A futures fund pays out the interest it earns on its Treasury collateral, less fees, and sometimes realized gains. That means distributions are small in a low-rate year and larger when short-term rates are high, and the amount can change sharply from one year to the next.
Invesco reports a 12-month distribution rate of 2.36% for DBC and 2.71% for PDBC, and a 30-day SEC yield of 2.90% for PDBC. COMT shows a 30-day SEC yield of 1.61%. The other funds did not give a comparable figure on the pages used, so they are marked Not captured on the comparison pages rather than estimated. Distribution schedules differ, and some payouts are classified as return of capital, so read each issuer page.
See what is dividend yield and yield vs total return for how to read yield next to price change.
Commodity ETF holdings and overlap
Matched commodity by commodityEvery comparison page matches the two funds by underlying commodity and adds up the smaller of the two weights for each commodity both hold. Futures on Brent crude held by two different funds count as one shared commodity.
The range runs from 42% for USCI and BCI to 96% for DBC and PDBC. DBC and PDBC share 96% because they use the same 27-commodity universe, while USCI overlaps least with everything because its basket is chosen by a different rule. Funds on the GSCI, GSG and COMT, share 92%.
| Comparison | Portfolio overlap |
|---|---|
| DBC vs PDBC | 96% |
| DBC vs GSG | 88% |
| DBC vs USCI | 45% |
| DBC vs BCI | 75% |
| DBC vs COMT | 91% |
| PDBC vs GSG | 88% |
| PDBC vs USCI | 44% |
| PDBC vs BCI | 72% |
| PDBC vs COMT | 91% |
| GSG vs USCI | 42% |
| GSG vs BCI | 73% |
| GSG vs COMT | 92% |
| USCI vs BCI | 42% |
| USCI vs COMT | 45% |
| BCI vs COMT | 70% |
Overlap is an estimate. Weights are shares of each fund’s futures exposure, dated Nov 9, 2026 for DBC, USCI and COMT, Oct 31, 2026 for PDBC and BCI sectors, and 2026 index reference weights for GSG and BCI. Treasury bills, cash and collateral are excluded.
Use overlap before you add a second fund. Owning DBC and PDBC repeats about 96% of the same exposure, so a second broad fund adds little. Test your own mix with the Diversification Calculator.
Commodity ETF comparison, all fifteen pairs
Head to head, same formatEach page below puts two funds side by side on cost, overlap, sector mix, returns, tax form and the ten largest commodities. Every figure carries its date, and the data room at the bottom of each page lists the source and grade of each number. These commodity ETF comparisons are the quickest way to see what you own and what you would add.
DBC vs PDBC
The same 27 commodities as an index fund with a K-1 and as an active fund with a 1099.
Read the comparisonDBC vs GSG
Roll-yield selection against a single production-weighted futures contract.
Read the comparisonDBC vs BCI
A 27-commodity roll-yield basket against capped Bloomberg weights.
Read the comparisonPDBC vs COMT
An active fund against a dynamic-roll index fund, both with a 1099.
Read the comparisonGSG vs COMT
Two GSCI funds, one with a single index future and one with a dynamic roll.
Read the comparisonHow to compare commodity ETFs
A seven-point checklist- 1. Index Check which index the fund follows and how it weights commodities.
- 2. Structure Check whether the fund holds futures through a subsidiary and whether it files a K-1 or a 1099.
- 3. Cost Expense ratios run from 0.26% to 1.05% here. Add the bid/ask spread when you trade.
- 4. Mix Compare energy, farm, metals and livestock shares. Energy runs from 34% to 57%.
- 5. Overlap If most of the commodities repeat what you own, a second fund adds little.
- 6. Roll rule Ask how the fund picks contract months, because roll cost can matter as much as price.
- 7. Dates and sources Do not rank funds on mismatched dates. Compare returns only when the periods match.
Start with how to research an ETF if the terms are new, and size any commodity fund inside your whole allocation with asset allocation explained.
Commodity ETF fees and what you really pay
Cost beyond the expense ratioThe expense ratio is the annual fee taken from the fund. On a $100,000 balance, 0.26% is $260 a year, 0.48% is $480 and 1.05% is $1050. Some funds report a total cost above the net ratio, for example DBC’s 0.89% before a waiver and PDBC’s 0.74% with acquired fund fees, so read the prospectus. Use the ETF Fee Calculator to turn a fee gap into dollars over time.
Trading costs come from the bid/ask spread. Issuers reported 30-day or median spreads of about 0.03%% to 0.25%%. Commodity prices can swing sharply, so spreads can widen on volatile days. Use limit orders for larger amounts.
Tax cost matters most for K-1 funds. A fund that files a Schedule K-1 can add forms at tax time, and futures gains are generally taxed under the 60/40 rule, while 1099 funds are simpler but can pass through ordinary income. Confirm the details with a qualified tax professional.
Which commodity ETFs suit which investor
Matching the fund to the planYou want the lowest fee and a 1099: BCI at 0.26%, then COMT at 0.48%. Compare them on the BCI vs COMT page.
You want a broad basket from Invesco: DBC as an index fund or PDBC as an active fund. See DBC vs PDBC.
You want production-weighted exposure: GSG or COMT follow the S&P GSCI. Read GSG vs COMT.
You want a different mix from the oil-heavy funds: USCI chooses its basket by rule. See USCI vs BCI.
You already own stocks and bonds: commodities behave differently, so a small position can diversify, but size it against your whole portfolio and your time horizon. Check what you own with the Diversification Calculator.
Common mistakes with commodity ETFs
Easy ones to avoidOwning two broad commodity funds. DBC plus PDBC repeats about 96% of the same exposure. Two tickers can still be one holding.
Assuming a commodity fund tracks spot prices. Roll cost and collateral interest change the result, so a fund can lag or beat the price of oil.
Ignoring the tax form. A K-1 fund adds reporting and may not suit every account. Check before you buy.
Comparing returns over different dates. Issuers report to different month-ends. Compare returns only when the dates match.
Chasing last year. One-year returns ran as high as 55% on the dates shown. One strong year says little about the next.
Holding commodities as a single bet. A commodity fund concentrates risk in oil and metals, so size the position inside a diversified allocation.
Risks of commodity ETFs
What diversification does not removeCommodities are volatile
Oil, metals and crops respond to supply shocks, weather and politics, and a broad commodity fund can fall while stocks rise.
Contango can drag returns
When later contracts cost more than the near one, rolling costs money even if the spot price is flat.
K-1s, swaps and subsidiaries
Some funds hold futures through a subsidiary or use swaps, which adds tax forms and counterparty risk.
Owning many commodities lowers the risk of any one market, but it does not remove commodity risk. The funds can fall together and the recovery can take years. Past gains are not a limit on future losses.
Commodity ETFs for Canadian investors
Currency, withholding tax and accountsU.S.-listed funds such as DBC, PDBC, GSG, USCI, BCI and COMT trade in U.S. dollars. Buying them from a Canadian account usually involves converting Canadian dollars, which adds a cost, and a move in the U.S. dollar also changes your return in Canadian dollars.
A fund that files a Schedule K-1 can create extra reporting for a Canadian holder and may not suit an RRSP or TFSA, while a fund that issues a 1099 is simpler. The treatment depends on the account type.
Confirm the rules for your accounts with a qualified tax professional, and see how to build an ETF portfolio for how a commodity fund fits inside an allocation.
Tools for comparing commodity ETFs
Run your own numbersHow commodity ETFs are researched here
Sources and datesFigures come from the issuer pages and files for each fund: Invesco for DBC and PDBC, iShares for GSG and COMT, USCF for USCI and abrdn for BCI. Gaps are shown as Not captured, and nothing was filled from memory or from another fund.
Weights are computed by underlying commodity. DBC, USCI and COMT come from issuer holdings dated Nov 9, 2026, and PDBC from Invesco’s Oct 31, 2026 commodity exposure. GSG publishes no commodity weights, so S&P Dow Jones Indices’ 2026 reference weights are used. BCI publishes sector weights only, so Bloomberg 2026 target weights are scaled to abrdn’s sector weights. Overlap sums the smaller weight of each commodity and is an estimate. The pages are educational research, not personal advice, and they do not recommend any fund.
Commodity ETFs, questions answered
Plain answersWhat are commodity ETFs?
Commodity ETFs are exchange-traded funds that give exposure to raw materials such as oil, natural gas, gold, copper and crops. Most do it by holding futures contracts, with the rest of the money in Treasury bills, so they hold contracts rather than physical goods. This page compares six broad funds: DBC, PDBC, GSG, USCI, BCI and COMT.
What is the difference between DBC and PDBC?
Both use the same 27-commodity universe. DBC follows the DBIQ Optimum Yield index passively, charges 0.82% and files a Schedule K-1. PDBC is actively managed, charges 0.59% and issues a 1099. They overlap by about 96% by commodity.
Which commodity ETF has the lowest cost?
BCI lists the lowest net expense ratio at 0.26%, followed by COMT at 0.48%, PDBC at 0.59%, GSG at 0.75%, DBC at 0.82% and USCI at 1.05%. On $100,000 that is $260 a year for BCI against $1050 for USCI.
Which commodity ETFs issue a K-1?
DBC, GSG and USCI issue a Schedule K-1. PDBC, BCI and COMT issue a 1099. The form changes tax reporting, so confirm the details for your account with a tax professional.
Why does USCI overlap so little with the other funds?
USCI picks 14 commodities each year from a larger list using price trends, so its mix differs from index funds that hold fixed baskets. Its overlap with the others ran from 42% to 45% by commodity.
Do commodity ETFs pay dividends?
Commodities do not pay dividends. These funds distribute interest earned on their Treasury collateral, less fees, and sometimes gains. Amounts vary with interest rates and can be classified as return of capital, so check each issuer page.
Are commodity ETFs risky?
Yes. Commodity prices swing with supply shocks, weather and politics, and futures funds can lose money when markets are in contango. One-year NAV returns on the dates shown ran from 40% to 55%, which shows how large the swings can be.
Should I own more than one commodity ETF?
Usually not. The funds overlap by 42% to 96% of their exposure. A second fund helps mainly when it holds a different mix, as USCI does.
Do commodity ETFs hedge inflation?
Commodity prices often rise when inflation does, but the link is not reliable and varies by period. A commodity fund can also fall when inflation is high. Treat it as one tool inside a wider plan, not a guarantee.
Are commodity ETFs a good fit for Canadian investors?
U.S.-listed funds can work, but you face currency conversion and tax-form questions that depend on the account. K-1 funds can add reporting. Confirm the details with a qualified tax professional.
Educational research, not personalized investment, tax or legal advice, and not a recommendation to buy or sell any fund. Investing involves risk, including loss of principal. Past performance does not guarantee future results. Fund data are provided as published by the sources named and may differ from current figures.