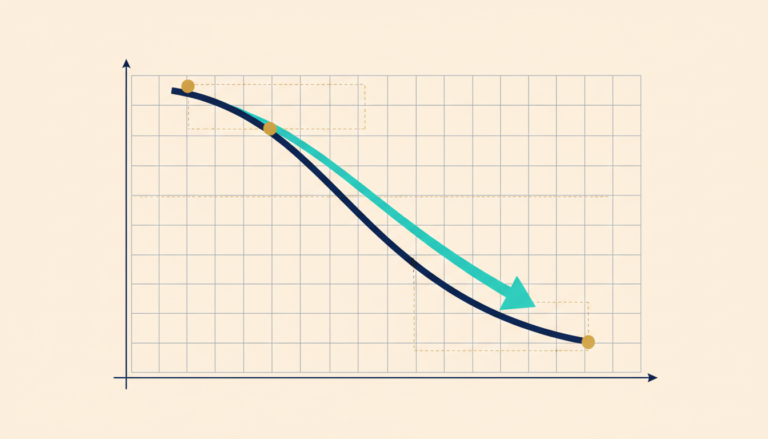
Nominal vs Real Values: Understanding Money and Purchasing Power
Learn how to adjust income, wages, returns and output for price changes—and why a rise in dollars does not always mean a rise in purchasing power.
A nominal value is expressed in the money units measured for the relevant period. A real value adjusts a monetary comparison for changes in a specified price measure. The distinction helps answer whether an increase in dollars represents more purchasing power or partly reflects higher prices.
Suppose monthly income rises from $4,000 to $4,200. The household receives 5% more dollars. If the relevant prices also rise by 5%, its income buys the same quantity of the reference basket under that measure. The nominal increase is real money received, but it does not create greater index-adjusted purchasing power.
This article explains the calculations and their limits through original household, business and production examples. We distinguish price levels from inflation rates, exact adjustments from approximations, and purchasing-power measures from broader wellbeing. All numbers are hypothetical rather than current economic data.
Learning objectives
You should be able to convert a monetary value between price bases, calculate real growth, interpret a price index and explain why different deflators answer different questions. You should also recognize that a national average price measure does not reproduce every household’s experience.
Read Stocks and Flows in Economics first if dates and periods are unclear. Percentages and simple division are enough for most examples. The central habit is to state which prices, period and population the adjustment represents before interpreting the result.
1. Nominal vs Real Values: Why Nominal Amounts Matter
The distinction between nominal vs real values is not a judgment that nominal money is unimportant. Understanding nominal vs real values helps separate the amount received in dollars from the purchasing power those dollars represent. The word nominal can sound dismissive, but nominal amounts determine many actual payments. Rent, salaries, loan balances and account balances are commonly specified in currency units. A household must meet its contractual bills using money, not an abstract inflation-adjusted income measure.

Real analysis answers a different question: what do those units of money command relative to a chosen price reference? This is the practical meaning of nominal vs real purchasing power. Both perspectives matter. A household can experience cash-flow pressure even when a broad real-income measure improves, because payment timing, debt obligations or particular expenses differ.
Avoid saying a nominal raise is not a real raise without explaining the intended meaning. The worker did receive more dollars. The question is whether those dollars buy more under the specified adjustment. Precise language preserves the distinction rather than implying that monetary changes have no practical consequences.
2. A price index summarizes a defined comparison
A price index tracks changes in prices under a particular statistical method. An index set to 100 in a reference period does not mean goods cost $100 or that inflation is 100%. The value is a convenient scale for comparing price levels across periods.
If the index moves from 100 to 108, the measured price level rises by 8%. If it later reaches 112, the increase from the original reference is 12%, but the increase from 108 is about 3.70%. The denominator depends on the comparison being made.
The Bank of Canada consumer price index page describes CPI as an indicator of consumer price change and explains its connection with purchasing power. For applied work, consult the actual index definition, coverage and methodology. A consumer basket is not the same as a business input index or the broad price measure associated with domestic production.
3. Calculate the inflation rate from two index levels
The percentage change equals the later index divided by the earlier index, minus one, multiplied by 100. Suppose the index rises from 125 to 130. The rate is 130 divided by 125 minus one, or 4%. The five-index-point increase is not a 5% increase.
This distinction matters whenever the index does not begin at 100. Index points describe a difference on the chosen scale. Percentage changes describe that difference relative to the starting level. Changing the index’s reference scale does not change the percentage movement between the same dates.
For example, rescale 125 and 130 to 100 and 104. The difference in index points becomes four, while inflation remains 4%. A clear explanation reports the dates and calculation rather than assuming that the reader can infer the denominator from the chart.
4. Convert current dollars into reference-period dollars
To compare nominal vs real values across time, express a later nominal amount in earlier-period purchasing-power units, multiply it by the earlier price index divided by the later index. Suppose a later monthly income is $4,400, with an index of 110 compared with 100 in the reference period. Its reference-period value is $4,000.
This says $4,400 later buys the same amount of the reference basket as $4,000 did earlier, under the selected index. It does not say the household literally receives $4,000 or that every price rose equally. The calculation changes the measurement unit, not the money paid.
The reverse conversion is also useful. A reference-period expense of $2,500 corresponds to $2,750 at an index of 110 if the reference index was 100. The result answers what later nominal amount preserves purchasing power under that measure. Actual personal expenses may change differently because quantities and spending patterns also change.
5. Use the exact real-growth relationship
For nominal vs real income comparisons, real growth equals one plus nominal growth, divided by one plus inflation, minus one. Rates must be expressed consistently as decimals inside the calculation. If nominal income grows by 7% and the relevant price measure grows by 4%, the exact result is 1.07 divided by 1.04 minus one, or about 2.88%.
Subtracting 4% from 7% gives the convenient approximation of 3%. The approximation is often close when rates are small, but it is not an identity. At larger rates, the discrepancy becomes more important. A calculator should use the ratio formula and explain when rounded mental arithmetic is being used.
The relationship follows from comparing monetary growth with the growth in the price reference. It does not require a forecast or a claim about why prices changed. Establishing the causes of inflation or wage growth is a separate economic question that needs additional evidence.
6. Work through a household example from start to finish
The fictional Chen household receives $5,000 monthly take-home income in the first period and $5,300 in the second. Its nominal increase is 6%. Assume the selected consumer price index rises by 4%. Index-adjusted income growth is 1.06 divided by 1.04 minus one, or approximately 1.92%.
The later income expressed in earlier-period prices is $5,300 divided by 1.04, or about $5,096.15. Compared with the original $5,000, purchasing power rises by about $96.15 per month under this measure. That is another expression of the same real-growth result.
The calculation assumes consistent income definitions and comparable household circumstances. A change in family size, work hours, benefits or taxes can affect the broader interpretation. The result is useful because it answers a precise question; it should not be presented as a complete measure of the household’s welfare.
7. Hourly wages and total earnings can tell different stories
Suppose hourly pay rises from $20 to $21, a 5% nominal increase, while weekly paid hours fall from 40 to 36. Weekly earnings fall from $800 to $756, a decline of 5.5%. The wage-rate increase does not establish an earnings increase.
If the relevant price measure rises by 3%, the real hourly wage rises by about 1.94%, while real weekly earnings fall by about 8.25%. Both calculations can be correct because they measure different outcomes. A report should identify whether it concerns hourly rates, weekly earnings or annual income.
Reduced hours could be voluntary or involuntary, and the difference matters for wellbeing. More free time might be valuable, but lost work can create serious hardship. The inflation adjustment does not reveal which situation applies. Economic interpretation requires combining the calculation with information about the circumstances and the question being asked.
8. Slower inflation does not reverse earlier price increases
A price index rises from 100 to 110, then to 115.5. Inflation falls from 10% to 5%, but the measured price level continues upward. The second-period basket is 15.5% more expensive than at the beginning.
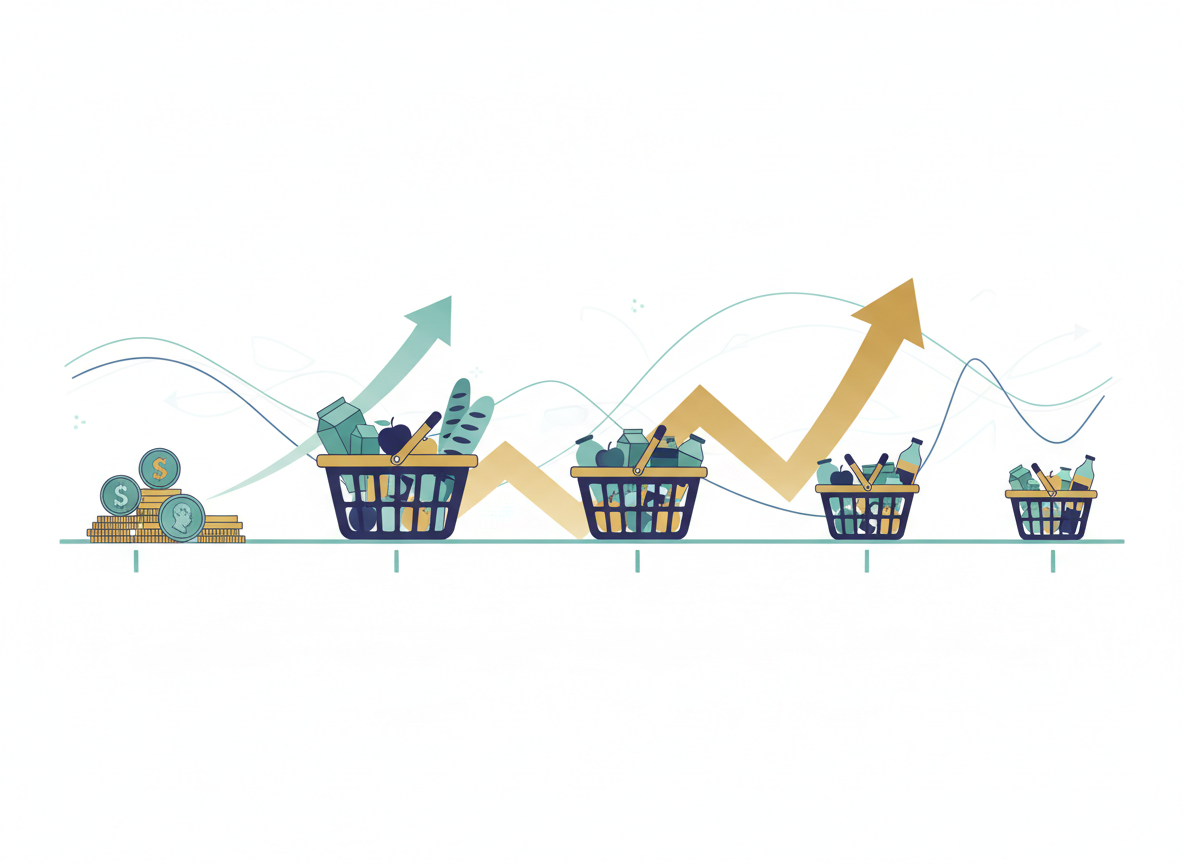
The distinction between disinflation and deflation matters. Disinflation means the inflation rate declines; deflation refers to a falling price level under the relevant measure. The Bank of Canada’s explanation of inflation discusses inflation, purchasing power and disinflation. Neither term should be inferred from one product’s price without considering the measure in question.
For household purchasing power, a lower inflation rate can reduce the pace of erosion while leaving past increases in place. Income growth must be compared with the appropriate period’s price movement. Saying inflation fell to 2% does not establish that a household’s cost of living returned to an earlier level or that its wages caught up with previous losses.
9. Compound changes across multiple periods
Suppose prices rise by 4% in the first year and 3% in the second. The cumulative price factor is 1.04 times 1.03, or 1.0712. The two-year increase is 7.12%, not exactly 7%. Compounding reflects that the second increase applies to the already higher level.
If income rises by 5% in each year, its cumulative factor is 1.1025. Dividing that by 1.0712 gives cumulative real growth of about 2.92%. The comparison must use matched periods rather than subtract a two-year inflation total from a one-year income rate.
For longer histories, use actual index levels where available rather than repeatedly rounding annual rates. Rounding can accumulate discrepancies. Also check whether a reported change is year-over-year, annual average, month-over-month or annualized. Those conventions describe different comparisons and should not be mixed simply because all are expressed as percentages.
10. Averages do not reproduce every household’s basket
The Chen household spends heavily on rent and childcare, while another household owns its home outright and spends more on transport. Their personal expenditure pressures can differ even when they live in the same country and face the same published inflation rate.
A broad consumer index remains useful for summarizing a defined population’s price changes. It is one reason nominal vs real comparisons must identify whose purchasing power the index is intended to represent. It is not designed to make every person’s experience identical to the average. A household-specific calculation can help explain differences, but it should use consistent quantities and distinguish price changes from changes in consumption.
If the family doubles spending on travel by taking more trips, that increase is not entirely travel inflation. If childcare use falls because a parent reduces paid hours, expenditure may decline even while the price per hour rises. Separating quantity, quality and price prevents a budget change from being mislabeled as a pure cost-of-living measure.
11. Choose a deflator that fits the question
A consumer price measure is suitable for many household purchasing-power comparisons. A producer considering machinery costs may need a different index. A measure of domestic output prices covers a different set of goods and services from household consumption, including different treatment of imports and other categories.
Using one convenient index for every monetary series can answer the wrong question. Deflating a specialized construction budget with a broad consumer index may overlook sector-specific cost movements. The calculation can be mathematically correct while the chosen adjustment is unsuitable.
A professional explanation identifies the deflator and why it fits. If a suitable index is unavailable, disclose the limitation rather than inventing precision. Sensitivity comparisons using plausible alternatives can reveal how much the result depends on the choice. The goal is a meaningful unit of comparison, not merely removing inflation with whichever number appears first.
12. Nominal revenue growth differs from real output growth
A fictional furniture maker sells 100 identical desks at $400, producing $40,000 in revenue. Later it sells 105 desks at $420, producing $44,100. Nominal revenue rises by 10.25%, while physical output rises by 5% and the price per desk rises by 5%.
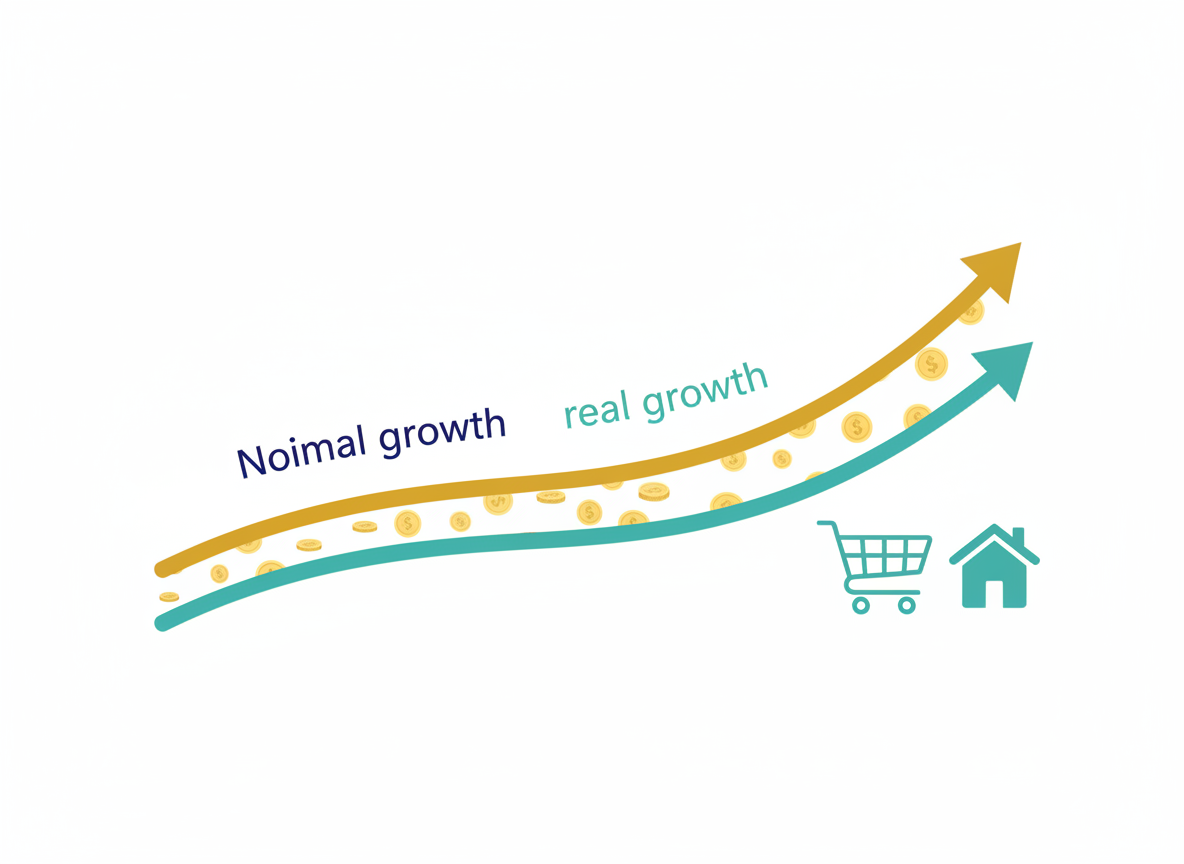
Dividing the revenue-growth factor 1.1025 by the product-price factor 1.05 gives 1.05, or 5% real growth in this single-product, unchanged-quality example. The calculation is transparent because the product and price measure align exactly.
A multi-product business is more complicated. The sales mix can shift toward expensive items, quality can change and discounts can vary. Revenue divided by a broad consumer index may not isolate physical production. Interpret real revenue according to the chosen measure and avoid treating it automatically as profit, productivity or a complete measure of the business’s economic contribution.
13. Real GDP removes price effects from production comparisons
Nominal vs real GDP comparisons begin with two different measurement bases. Nominal GDP values production at the prices relevant to the measured period. Real GDP measures aim to separate changes in production volume from changes in prices using a statistical framework. The U.S. Bureau of Economic Analysis GDP overview distinguishes current-dollar and real measures.
For a simple two-good teaching economy, one could value both periods’ quantities at common base-period prices. That illustrates why output can increase even when nominal spending is affected by falling prices. Actual national statistics use more sophisticated methods and should be interpreted using their published conventions.
Real GDP growth is not a complete welfare measure. Distribution, unpaid work, environmental effects and leisure can matter beyond the aggregate. Nor does a country’s rising total output necessarily imply rising output per person. The real adjustment answers one measurement problem; it does not eliminate every limitation of the underlying concept.
14. A real increase is not necessarily a causal effect
Suppose a training participant’s inflation-adjusted earnings rise by 8%. That establishes a measured change under the selected earnings definition and price adjustment. It does not show that training caused the increase. Economic recovery, additional hours or a change in employer may contribute.
The distinction connects this article with Correlation vs Causation in Economics. Deflation improves monetary comparability; a research design addresses attribution. Neither substitutes for the other. A causal study using nominal earnings may need an inflation adjustment, while an inflation-adjusted before-and-after comparison still needs a credible counterfactual.
Clear reporting states both what changed and what explains the evidence. A phrase such as real earnings gain should not be used to imply that the effect is causally established or universally beneficial. Real has a technical measurement meaning, not a guarantee of analytical completeness.
15. Realized returns and purchasing power
Assume an investment position earns a 6% nominal total return over a year, measured consistently and before any relevant taxes or fees not already included. If the chosen price index rises by 4%, the inflation-adjusted return is 1.06 divided by 1.04 minus one, or about 1.92%.
The calculation requires total return rather than income yield alone. Distributions and price changes both matter, and contributions or withdrawals must be handled appropriately in the return measure. A higher account balance can reflect new deposits rather than investment performance, as the stocks-and-flows article explains.
This is educational arithmetic, not an investment recommendation. The appropriate return comparison depends on risk, timing, costs, taxes and the purpose of the funds. An inflation adjustment does not make a risky investment safe or establish that a historical return will recur. It simply expresses the measured outcome relative to a price reference.
16. Expected and realized real rates are different
Before a period occurs, future inflation is unknown. An expected real rate uses an expectation about inflation. Afterward, a realized comparison uses the price change that actually occurred, subject to measurement and the specified return convention. The two need not match.
Suppose a nominal one-period rate is 5% and expected inflation is 2%. A simple exact scenario calculation gives about 2.94% using those assumed values. If realized inflation turns out to be 6%, the ex-post inflation-adjusted result is about negative 0.94%. The nominal contract did not change, but purchasing-power outcomes differed.
For uncertain inflation, the relationship between expected real outcomes and a ratio using expected inflation can be more subtle because expectations and nonlinear transformations do not always commute. At this introductory level, label the calculation as a scenario based on an assumed inflation rate, rather than a complete model of risk-adjusted expected returns.
17. Fixed nominal debt and changing purchasing power
An outstanding $10,000 nominal obligation remains $10,000 in currency units if the contract and principal do not change. With higher prices, that amount corresponds to fewer units of a chosen consumption basket. This does not mean the borrower automatically finds repayment easier.
Income may fail to rise, interest rates may reset, essential expenses may increase or employment may be lost. The real burden relative to income and the purchasing-power value of principal are related but distinct comparisons. A borrower pays from available resources under actual contract terms.
A responsible explanation therefore avoids saying inflation always benefits debtors. Identify the currency, rate structure, income response and timing. The arithmetic of a fixed nominal amount can be explained clearly without making a universal behavioral or financial recommendation. Later articles examine monetary contracts and distributional effects in greater depth.
18. Purchasing power across time differs from exchange rates
Converting Canadian dollars into U.S. dollars uses an exchange rate. Adjusting Canadian dollar income for Canadian consumer prices compares purchasing power across time under a domestic price measure. These operations answer different questions.
A currency can appreciate while domestic consumer prices rise. A traveler may find foreign purchases cheaper in local-currency terms even while some domestic expenses increase. Comparing living standards across countries requires attention to different price levels, consumption patterns and appropriate conversion measures, not exchange rates alone.
Do not treat an exchange-rate-adjusted salary as automatically comparable purchasing power between countries. Housing, public services, taxes and household circumstances can differ. A later international-economics chapter develops purchasing-power comparisons. Here, the main distinction is between changing the currency unit and adjusting the price reference for a defined set of purchases.
19. Base periods change the scale, not the underlying movement
Suppose an income is expressed in reference-year dollars using an index of 100 in that year. Rebasing the index to another year changes the numerical real-dollar amounts, but consistent rebasing should not alter the percentage growth between the same two dates under the same index structure.
This is similar to measuring distance in meters or centimeters: the scale changes, while the underlying comparison remains. The analogy is imperfect because economic indexes can also be revised or updated, so check whether a publication changed only the reference scale or also its method and weights.
When combining series, verify that they use compatible price bases and methods. Two values labeled constant dollars may refer to different reference years or concepts. Adding or comparing them without adjustment can produce an invalid total. Detailed methodological notes are part of the evidence, not optional decoration for advanced readers only.
20. Practice checking a salary claim
A salary rises by 3% while the relevant annual price index rises by 5%. Exact real salary growth is 1.03 divided by 1.05 minus one, or approximately negative 1.90%. The nominal salary increased, but its purchasing power under that measure declined.
Now ask whether work hours, bonuses, benefits or taxes changed. A salary-rate comparison may differ from take-home income or hourly compensation. If the person worked fewer hours voluntarily, the welfare interpretation can differ from an involuntary reduction. The calculation should state its precise object before drawing a broad conclusion.
An accurate sentence is: the stated salary increased by 3%, corresponding to about a 1.90% decline after adjustment for the selected 5% price increase, before considering other compensation or circumstances. That is more informative than saying the person received no raise or lost exactly 2% of their entire standard of living.
21. Practice interpreting falling inflation
The price index moves from 100 to 106 and then to 109.18. Inflation is 6% in the first interval and 3% in the second. The price level is still rising, and its cumulative increase is 9.18%. A headline saying prices fell because inflation halved would be incorrect for this example.
Suppose income rises by 4% during each interval. Its cumulative increase is 8.16%, which is below the cumulative price rise. The exact cumulative real change is 1.0816 divided by 1.0918 minus one, or about negative 0.93%. A period of lower inflation does not by itself restore earlier purchasing-power losses.
The lesson is to match the entire income path with the entire price path. Looking only at the final year’s rates can miss accumulated changes. At the same time, do not describe past losses as permanent without examining subsequent income, prices and household circumstances.
22. Practice choosing the correct interpretation
A business reports 12% nominal revenue growth and a 7% increase in its own output prices for comparable products. Under a suitable unchanged-mix simplification, real revenue growth is 1.12 divided by 1.07 minus one, or about 4.67%. That does not establish profit growth because costs are absent from the comparison.
A household deposit balance rises by 10%, but half the increase comes from new contributions. Calling the entire balance change a 10% nominal investment return would be wrong. First measure return appropriately, then perform the price adjustment. Inflation cannot repair a misclassified numerator.
A country reports real GDP growth of 2% and population growth of 3%. Total inflation-adjusted production rises while a simple output-per-person measure falls by approximately 0.97%, using 1.02 divided by 1.03 minus one. Different measures can move in different directions without contradiction.
23. A reliable reporting method
When reporting nominal vs real values, state the nominal measure, the dates, the deflator and the reference basis. Show the calculation or provide enough inputs to reproduce it. Label exact results and approximations clearly. Explain whether the adjustment concerns an income rate, a total amount, a return or production volume.
Then state the limits. Does the index fit the population and spending pattern? Are quality and quantity changes handled appropriately? Are taxes, fees or contributions relevant? Does the statement describe a change or claim a cause? These questions prevent technically correct arithmetic from supporting an exaggerated conclusion.
Finish with the economic meaning in ordinary language. The reader should understand what can be bought, produced or compared under the measure, not merely see a percentage. A strong explanation connects the result to the question while leaving broader judgments about wellbeing, fairness and policy open to the additional evidence they require.
24. Price increases and purchasing-power losses use different denominators
If the reference basket’s price rises by 10%, an unchanged dollar amount buys about 9.09% less of that basket. The calculation is one divided by 1.10, minus one. A 10% price increase and a 10% purchasing-power decline are not exact mirror images because the denominators differ.
Likewise, a price falling from $100 to $90 declines by 10%, but returning from $90 to $100 requires an increase of about 11.11%. Percentage changes describe movements relative to their starting values. Reversing the direction changes the starting value and therefore the percentage required.
This is useful when interpreting claims that wages must rise by a particular amount to recover a loss. First identify whether the loss was stated as a price increase, a nominal income decline or a real purchasing-power change. Then use consistent factors to calculate recovery. Adding the same percentage in the opposite direction may not restore the starting position.
The arithmetic is elementary, yet the interpretation matters. Clear explanations state the base and avoid treating all percentage differences as interchangeable. A calculator should show the formula and units so readers can understand why two descriptions of the same movement can have different numerical percentages.
Nominal-to-Real Purchasing Power Calculator
Convert a later money amount into reference-period dollars and calculate exact real growth from nominal growth and inflation. Enter rates as percentages.
Using 100 ÷ 110 to convert $4,400 into reference-period dollars.
This calculator applies the stated index ratio and exact growth formula. It does not select the correct deflator for you, account for taxes or fees, or measure an individual’s complete cost of living. Use matched periods and consistent definitions.
Continue Learning in the Invest & Compound Academy
Efficiency vs Equity is next in sequence and examines how resource use and distribution enter economic evaluation. Later inflation material explores price-index construction in greater depth. Investment-return articles connect purchasing power with total return, while national-accounting topics develop real output measures.
All topics in this chapter
References & Official Data Sources
- Bank of Canada — Consumer Price Index. CPI definitions, price measurement and purchasing-power context.
- Bank of Canada — Understanding Inflation. Inflation, purchasing power and disinflation.
- U.S. Bureau of Economic Analysis — What to Know About GDP. Current-dollar and real GDP concepts.
All household, salary, business and return calculations are original hypothetical teaching examples. They are not current inflation statistics, forecasts or descriptions of an actual portfolio. The sources support the measurement concepts; the arithmetic follows the stated assumptions. Source access date supplied in the editorial draft: October 22, 2026 UTC.
Educational disclosure
This lesson provides general economics education, not personalized investment, tax, legal or borrowing advice. Inflation-adjusted comparisons depend on the chosen measure and period. Hypothetical calculations do not predict individual financial outcomes.
Investments can lose value. Actual results depend on market performance, investment expenses, taxes, inflation, cash flows and account rules. Constant-return projections do not predict future performance.