Gold and Silver ETFs
Six physical metal trusts comparedA research hub for gold and silver ETFs and their comparisons: GLD, IAU, GLDM, SGOL, SLV and SIVR. This page shows what backs each share, what each trust costs, how closely each has tracked its metal and how the fifteen pairs compare. Every comparison page carries dated figures and sources.
Fund data from State Street, iShares and abrdn pages, Sep 30 to Nov 9, 2026 · Educational research, not advice
Gold and silver ETFs at a glance
Six things to know first- Physical metal. All six trusts hold allocated bullion bars in a vault, not futures and not mining stocks.
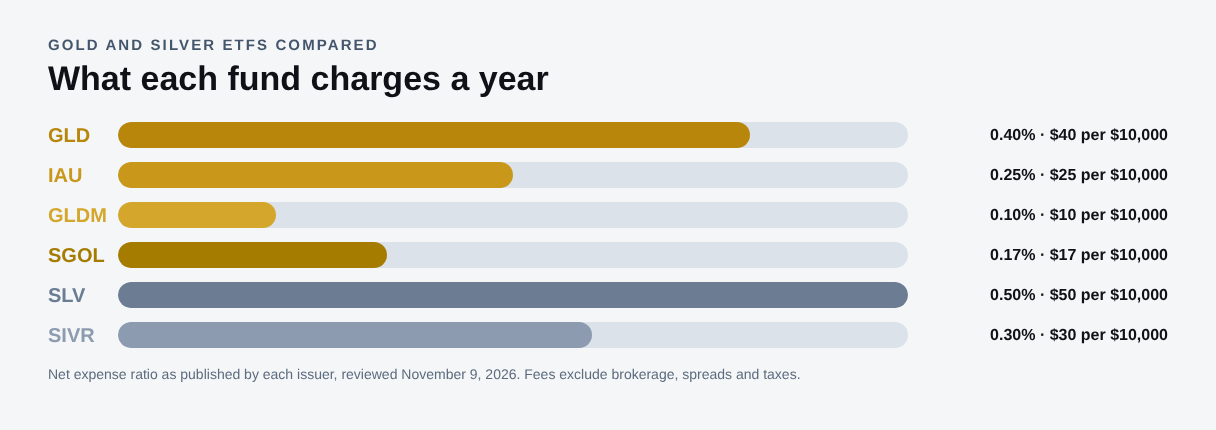
- Cost range. Expense ratios run from 0.10% to 0.50%, which is $400 a year on $100,000.
- Same gold, four prices. GLD, IAU, GLDM and SGOL hold the same metal at fees of 0.40%, 0.25%, 0.10% and 0.17%.
- No income. Bullion pays nothing, so none of the trusts has a yield.
- Silver swings harder. iShares reports a 3-year standard deviation of 45.13% for SLV against 20.19% for IAU.
- Tax is different. In the U.S., long-term gains on physical metal trusts are generally taxed as collectibles at up to 28%.
Core gold and silver ETFs, the six funds side by side
Dated figures, sources on each comparison| GLD | IAU | GLDM | SGOL | SLV | SIVR | |
|---|---|---|---|---|---|---|
| Fund | SPDR Gold Shares | iShares Gold Trust | SPDR Gold MiniShares Trust | abrdn Physical Gold Shares ETF | iShares Silver Trust | abrdn Physical Silver Shares ETF |
| Metal | Gold | Gold | Gold | Gold | Silver | Silver |
| Expense ratio | 0.40% | 0.25% | 0.10% | 0.17% | 0.50% | 0.30% |
| Cost per $10,000 a year | $40 | $25 | $10 | $17 | $50 | $30 |
| Share price (NAV, Nov 9) | $377.27 | $77.36 | $81.42 | $39.18 | $47.50 | $49.96 |
| Ounces behind one share | 0.0916 | 0.0188 | 0.0198 | 0.0095 | 0.903 | 0.949 |
| Net assets | $137.93B (Nov 9) | $60.99B (Nov 9) | $31.38B (Nov 9) | $7.02B (Nov 9) | $26.55B (Nov 9) | $3.58B (Nov 9) |
| Custodian | HSBC Bank plc and JPMorgan Chase Bank, N.A. | Not captured | JPMorgan Chase Bank, N.A. | ICBC Standard Bank (United Kingdom) | Not captured | ICBC Standard Bank (United Kingdom) |
| Reference price | LBMA Gold Price PM | LBMA Gold Price | LBMA Gold Price PM | LBMA Gold Price PM | LBMA Silver Price | LBMA Silver Price |
| Launched | 2004 | 2005 | 2018 | 2009 | 2006 | 2009 |
Figures come from each issuer page dated Nov 9, 2026. Ounces per share use issuer ounces in trust where published (IAU and SLV) and otherwise NAV divided by the metal price on the same day. iShares pages did not list the custodian, so it is marked Not captured.
GLDM is the lowest-cost fund at 0.10%. SLV is the most expensive at 0.50%. Among the four gold trusts the metal is identical, so the fee, the share price and trading depth are what set them apart.
Gold and silver ETFs, fund by fund
What each one is and where it differsGLD
SPDR Gold Shares is the first U.S. gold ETF, launched in 2004, and the largest at $137.93B on Nov 9, 2026. It charges 0.40%, the highest fee of the four gold trusts, and State Street lists options as available on it. Its custodians are HSBC Bank plc and JPMorgan Chase Bank.
IAU
iShares Gold Trust launched in 2005 and held $60.99B on Nov 9, 2026, backed by about 14.8 million ounces of gold. It charges 0.25%. Its share price is about a fifth of GLD’s because each share represents less gold.
GLDM
SPDR Gold MiniShares Trust launched in 2018 as a low-cost companion to GLD and held $31.38B on Nov 9, 2026. It charges 0.10%, the lowest fee in the group. Its custodian is JPMorgan Chase Bank.
SGOL
abrdn Physical Gold Shares ETF launched in 2009 and held $7.02B on Nov 9, 2026. It charges 0.17%. abrdn states that it seeks to hold only bars refined in 2012 or later, which fall under the LBMA Responsible Gold Guidance.
SLV
iShares Silver Trust launched in 2006 and is the largest silver trust at $26.55B on Nov 9, 2026, backed by about 505 million ounces of silver. It charges 0.50% and is the most heavily traded fund in the group by share volume.
SIVR
abrdn Physical Silver Shares ETF launched in 2009 and held $3.58B on Nov 9, 2026. It charges 0.30%, which is 0.20 percentage points less than SLV for the same metal.
Gold and silver ETFs, what they hold and what they leave out
Bars in a vault, not futures or minersEach of these six funds is a trust that owns physical metal. The bars are allocated, which means specific bars are set aside for the trust and listed on a published bar list, and they sit in a vault run by a custodian bank. A share is a claim on a small slice of that metal. One share of GLD is backed by about 0.0916 ounces of gold and one share of IAU by about 0.0188, which is why their share prices differ even though the metal is the same.
These trusts do not hold futures contracts, so there is no roll cost of the kind that affects the broad commodity ETFs. They also do not hold mining companies, so they carry no business risk from a miner. The return is the change in the metal price, less the fee.
The fee is paid by selling a little metal. Because of that, the ounces behind each share fall slowly every year, by about the expense ratio. Over a decade a 0.40% fee uses up roughly 4% of the metal and a 0.10% fee about 1%.
When a gold trust fits: you want exposure to the gold price in a brokerage account without storing metal yourself. When a silver trust fits: you want silver and accept much larger price swings. These describe what the funds hold, not recommendations.
Gold against silver, why the two metals behave differently
One is mostly money, the other is half industryGold demand comes mostly from investors, central banks and jewelry, so its price reacts to interest rates, the U.S. dollar and fear. Silver has a large industrial side, including electronics and solar panels, so it also reacts to the business cycle. Silver is a much smaller market, which makes its price jump further in both directions.
The issuer data show the difference. iShares reports a 3-year standard deviation of 20.19% for IAU and 45.13% for SLV as of Sep 30, 2026, so silver has been more than twice as volatile. Over the year to Sep 30, 2026, IAU returned 8.90% and SLV 30.86% at NAV, and by Nov 9, 2026 the year-to-date figures were -4.64% and -27.23%.
Because the two metals are different assets, a gold trust and a silver trust share no holdings. Two gold trusts, by contrast, hold exactly the same thing.
Gold and silver ETF returns, same dates for all six
NAV total return to Sep 30, 2026All six issuers report returns to Sep 30, 2026, so the table below compares like with like. Figures are annualized NAV total returns, net of fees. The last column shows how far each trust trailed its benchmark metal price over 10 years, which should be close to its fee.
| Fund | 1 year | 3 years | 5 years | 10 years | 10-year gap to benchmark |
|---|---|---|---|---|---|
| GLD | 8.74% | 30.16% | 18.62% | 11.74% | 0.44 pts |
| IAU | 8.90% | 30.38% | 18.80% | 11.91% | 0.27 pts |
| GLDM | 9.07% | 30.54% | 18.96% | Not captured | Not captured |
| SGOL | 8.99% | 30.48% | 18.90% | 11.94% | 0.25 pts |
| SLV | 30.86% | 37.38% | 22.44% | 11.56% | 0.55 pts |
| SIVR | 31.13% | 37.65% | 22.68% | 11.78% | 0.34 pts |
Source: issuer fund pages (State Street, iShares and abrdn). GLDM launched in 2018, so it has no 10-year figure. Past performance does not guarantee future results.
The four gold trusts sit within a few tenths of a point of each other in every period, and the order follows the fees: the cheaper the trust, the closer it stays to the gold price. The two silver trusts show the same pattern against the silver price.
The 3-year figures of about 30% a year for gold and 37% for silver reflect an unusually strong run, and both metals fell from their highs during 2026. Read how to measure investment growth and nominal vs real values before treating any of these numbers as a forecast.
Gold and silver ETF yield, why there is none
No interest, no dividendsBullion earns nothing. A bar of gold does not pay interest and a bar of silver does not pay a dividend, so none of these six trusts has a yield or makes regular distributions. The whole return comes from the metal price.
That makes the fee more visible than in a stock or bond fund, where income can cover it. Here the fee is taken by selling metal, and an investor who needs cash has to sell shares.
See what is dividend yield and yield vs total return for how income and price change add up in other kinds of funds.
Gold and silver ETF holdings and overlap
One holding per trustOverlap is simple here. A trust holds one metal, so two gold trusts overlap completely and a gold trust and a silver trust do not overlap at all. Seven of the fifteen pairs below hold the same metal and eight hold different metals.
For same-metal pairs the fee gap is the main thing to compare. It runs from 0.08 points for IAU and SGOL to 0.30 points for GLD and GLDM.
| Comparison | Overlap by metal | Fee gap |
|---|---|---|
| GLD vs IAU | Same metal | 0.15 pts |
| GLD vs GLDM | Same metal | 0.30 pts |
| GLD vs SGOL | Same metal | 0.23 pts |
| GLD vs SLV | Different metals | 0.10 pts |
| GLD vs SIVR | Different metals | 0.10 pts |
| IAU vs GLDM | Same metal | 0.15 pts |
| IAU vs SGOL | Same metal | 0.08 pts |
| IAU vs SLV | Different metals | 0.25 pts |
| IAU vs SIVR | Different metals | 0.05 pts |
| GLDM vs SGOL | Same metal | 0.07 pts |
| GLDM vs SLV | Different metals | 0.40 pts |
| GLDM vs SIVR | Different metals | 0.20 pts |
| SGOL vs SLV | Different metals | 0.33 pts |
| SGOL vs SIVR | Different metals | 0.13 pts |
| SLV vs SIVR | Same metal | 0.20 pts |
Use overlap before you add a second fund. Owning GLD and IAU repeats one position in gold. Test your whole mix with the Diversification Calculator.
Gold and silver ETF comparison, all fifteen pairs
Head to head, same formatEach page below puts two trusts side by side on cost, what backs each share, tracking against the metal price, returns, trading and taxes. Every figure carries its date, and the data room at the bottom of each page lists the source and grade of each number.
GLD vs IAU
The same gold at 0.40% and 0.25%, with different share prices and custodians.
Read the comparisonGLD vs GLDM
The same gold at 0.40% and 0.10%, with different share prices and custodians.
Read the comparisonGLD vs SGOL
The same gold at 0.40% and 0.17%, with different share prices and custodians.
Read the comparisonIAU vs GLDM
The same gold at 0.25% and 0.10%, with different share prices and custodians.
Read the comparisonIAU vs SGOL
The same gold at 0.25% and 0.17%, with different share prices and custodians.
Read the comparisonGLDM vs SGOL
The same gold at 0.10% and 0.17%, with different share prices and custodians.
Read the comparisonSLV vs SIVR
The same silver at 0.50% and 0.30%, with different share prices and custodians.
Read the comparisonHow to compare gold and silver ETFs
A seven-point checklist- 1. Metal Decide whether you want gold, silver or both. They are different assets.
- 2. Cost Expense ratios run from 0.10% to 0.50% here, and the fee is the main difference between same-metal trusts.
- 3. Tracking Check how far the trust has trailed its benchmark. It should be close to the fee.
- 4. Trading Larger trusts usually trade with tighter spreads. Issuer pages showed 30-day median spreads of 0.01% to 0.02% where reported.
- 5. Share price A lower share price helps if you buy whole shares in small amounts. It does not make the metal cheaper.
- 6. Custody Read who holds the bars and where, and whether a bar list is published.
- 7. Dates and sources Compare returns only when the periods match, as they do on this page.
Start with how to research an ETF if the terms are new, and size any metal position inside your whole allocation with asset allocation explained.
Gold and silver ETF fees and what you really pay
Cost beyond the expense ratioOn a $100,000 balance, 0.10% is $100 a year, 0.25% is $250 and 0.50% is $500. Because two gold trusts hold the same metal, a fee gap flows almost one for one into the return gap, as the returns table shows. Use the ETF Fee Calculator to turn a fee gap into dollars over time.
Trading costs come from the bid/ask spread and from any premium or discount to NAV. On Nov 9, 2026 the issuer pages showed premiums of 0.04% to 0.05% for the State Street gold trusts, 0.57% for IAU and 1.35% for SLV, so the price you pay can differ from the value of the metal on a given day. Use limit orders for larger amounts.
Someone who trades often may value the deepest market more than the lowest fee, while a long-term holder usually gains more from the lower fee. Both are reasonable positions, and the comparison pages show the figures for each pair.
Which gold and silver ETFs suit which investor
Matching the fund to the planYou want gold at the lowest fee: GLDM at 0.10%, then SGOL at 0.17%. Compare them on the GLDM vs SGOL page.
You trade gold often or use options: GLD is the largest trust and has listed options. See GLD vs GLDM and GLD vs IAU.
You want silver: SLV is the larger trust and SIVR the cheaper one. Read SLV vs SIVR.
You are choosing between the metals: see GLD vs SLV for how differently gold and silver have behaved.
You already own stocks and bonds: metals behave differently and pay no income, so they usually play a small role. Check what you own with the Diversification Calculator and size any position against your whole portfolio.
Common mistakes with gold and silver ETFs
Easy ones to avoidOwning two gold trusts. GLD plus IAU is one position in gold with two fees to track.
Reading a low share price as a bargain. $10,000 buys about the same ounces of gold through any of the four gold trusts. Only the fee changes what you keep.
Treating silver like gold. Silver has been more than twice as volatile and fell far more in 2026.
Expecting income. None of these trusts pays a distribution.
Ignoring tax. In the U.S. the collectibles rate can apply to long-term gains, which differs from stock funds.
Chasing a strong run. Three-year returns near 30% a year are not normal for metals, and both fell from their highs in 2026.
Risks of gold and silver ETFs
What a vault does not removeMetals can fall for years
Gold and silver respond to interest rates, the dollar and sentiment, and long flat or falling periods are part of their history.
Nothing offsets the fee
With no interest or dividends, the fee and any fall in price come straight out of your return.
Bars held by a bank
The metal sits with a custodian. Read each prospectus for custody, insurance and sub-custodian terms.
Holding metal through a trust removes the work of storing it, but not the risk of the metal price. Past gains are not a limit on future losses.
Gold and silver ETFs for Canadian investors
Currency and accountsU.S.-listed trusts such as GLD, IAU, GLDM, SGOL, SLV and SIVR trade in U.S. dollars. Buying them from a Canadian account usually involves converting Canadian dollars, which adds a cost, and a move in the U.S. dollar also changes your return in Canadian dollars.
These trusts pay no dividends, so U.S. dividend withholding tax is not the main question. How gains are taxed depends on the account type and your own situation.
Confirm the rules for your accounts with a qualified tax professional, and see how to build an ETF portfolio for how a metal position fits inside an allocation.
Tools for comparing gold and silver ETFs
Run your own numbersHow gold and silver ETFs are researched here
Sources and datesFigures come from the issuer pages for each fund: State Street for GLD and GLDM, iShares for IAU and SLV, and abrdn for SGOL and SIVR. Fund facts are dated Nov 9, 2026 and returns Sep 30, 2026. Gaps are shown as Not captured, and nothing was filled from memory or from another fund.
Ounces per share use issuer ounces in trust divided by shares outstanding for IAU and SLV. For the others they are NAV divided by the metal price on Nov 9, 2026, using the LBMA Gold Price PM of $4,117.00 shown by State Street and the silver price implied by SLV. The tracking gap is the benchmark return minus the NAV return from the same issuer page. The pages are educational research, not personal advice, and they do not recommend any fund.
Gold and silver ETFs, questions answered
Plain answersWhat are gold and silver ETFs?
Gold and silver ETFs are exchange-traded trusts that hold physical bullion in a vault. Each share represents a small amount of metal, so the share price follows the metal price, less the fee. This page compares six of them: GLD, IAU, GLDM, SGOL, SLV and SIVR.
What is the difference between GLD and IAU?
Both hold gold bullion. GLD charges 0.40% and IAU charges 0.25%. GLD is larger, at $137.93B against $60.99B, and has a higher share price because each share represents more gold.
Which gold ETF has the lowest cost?
GLDM lists the lowest expense ratio at 0.10%, followed by SGOL at 0.17%, IAU at 0.25% and GLD at 0.40%. On $100,000 that is $100 a year for GLDM against $400 for GLD.
What is the difference between SLV and SIVR?
Both hold silver bullion. SLV charges 0.50% and SIVR charges 0.30%. SLV is much larger, at $26.55B against $3.58B.
Do gold and silver ETFs hold real metal?
Yes. These six trusts hold allocated bullion bars with a custodian, and each issuer publishes a bar list. They do not hold futures or mining stocks.
Do gold and silver ETFs pay dividends?
No. Bullion earns no income, so the trusts make no regular distributions and have no yield.
Why is silver more volatile than gold?
Silver is a smaller market and much of its demand is industrial, so it reacts to the business cycle as well as to investor demand. iShares reports a 3-year standard deviation of 45.13% for SLV against 20.19% for IAU as of Sep 30, 2026.
Should I own more than one gold ETF?
Usually not. Two gold trusts hold the same metal, so a second one adds no diversification.
How are gold and silver ETFs taxed?
In the United States, long-term gains on physically backed gold and silver trusts are generally taxed as collectibles at a maximum federal rate of 28%. Rules differ by country and account, so confirm the details with a tax professional.
Are gold and silver ETFs a good fit for Canadian investors?
U.S.-listed trusts can work, but you face currency conversion, and the tax treatment of gains depends on the account. Confirm the details with a qualified tax professional.
Educational research, not personalized investment, tax or legal advice, and not a recommendation to buy or sell any fund. Investing involves risk, including loss of principal. Past performance does not guarantee future results. Fund data are provided as published by the sources named and may differ from current figures.