ARKB vs HODL ETF comparison
ARKB vs HODL
ARKB is the ARK 21Shares fund, a mid-sized bitcoin trust sponsored by 21Shares, and HODL is the VanEck fund, a low-fee trust with a small share price. Both trusts hold bitcoin and nothing else, so they follow the same price.
What separates them is the fee, the share price, the custodian, the benchmark rate each uses and how heavily each one trades. ARKB charges 0.21% and HODL charges 0.20%. This page lines up what backs each share, what each trust costs, how each has performed and how each trades, with the date next to every number.
ARKB vs HODL, the short answer
ARKB and HODL hold the same asset. Both trusts hold bitcoin and nothing else, so they follow the same price. What separates them is the fee, the share price, the custodian, the benchmark rate each uses and how heavily each one trades.
Expense ratios are 0.21% and 0.20%, which is $21 and $20 a year per $10,000. NAV total returns, annualized: 1 year ARKB -26.76% (to Sep 30, 2026) and HODL -30.30% (to Oct 31, 2026). Neither is better for everyone; the choice turns on cost, trading needs and how much bitcoin risk you want.
Want the full picture of one fund before you compare? Read the complete guide for each fund: ARKB guide and HODL guide. Each guide covers fees, holdings, yield, returns and taxes.
ARKB vs HODL overlap, if you own both
Overlap is normally measured stock by stock. Here there is only one holding: each trust owns bitcoin held by a custodian, so every dollar in ARKB and every dollar in HODL is backed by the same asset. Owning both does not diversify anything; it only splits one position across two tickers.
The differences that remain are practical. ARKB charges 0.21% and HODL charges 0.20%. One share of ARKB is backed by about 0.000331 bitcoin and one share of HODL by about 0.000283, which only changes the share price, not the exposure. The custodian, the benchmark rate and the trading volume also differ, and those are compared below.
| ARKB | HODL | |
|---|---|---|
| Asset held | Bitcoin | Bitcoin |
| Bitcoin behind one share | 0.000331 | 0.000283 |
| Expense ratio | 0.21% | 0.20% |
| Custodian | Not captured | Not captured |
| Net assets | $2.24B (Oct 31, 2026) | $1.07B (Nov 9, 2026) |
ARKB vs HODL, one goal, which fund?
ARKB vs HODL, where the money goes
ARKB · ARK 21Shares Bitcoin ETF
HODL · VanEck Bitcoin ETF
ARKB vs HODL returns compared on 1-year return and since launch
ARKB vs HODL, what each fund costs a year
The data room
Every figure behind the ARKB vs HODL cards above, with its source, date and evidence grade. Open the issuer documents before relying on any number.
ARKB vs HODL key facts
Evidence grade: Issuer issuer page · Mixed issuer plus provider · 3rd party| Metric | ARKB | HODL | Grade and source |
|---|
Portfolio characteristics
| Metric | ARKB | HODL | Grade and source |
|---|
Net assets are dated by fund (ARKB $2.24B on Oct 31, 2026; HODL $1.07B on Nov 9, 2026). Figures an issuer page does not show are left out or marked Not captured, not estimated.
ARKB vs HODL holdings, what backs each share
Issuer pages · Nov 2026| Item | ARKB | HODL |
|---|---|---|
| What the trust holds | Bitcoin | Bitcoin |
| Other holdings | None reported, apart from small cash amounts for expenses | None reported, apart from small cash amounts for expenses |
| Bitcoin behind one share | 0.000331 | 0.000283 |
| Custodian | Not captured | Not captured |
| Shares outstanding | Not captured | 50.78M |
| Sponsor | 21Shares US LLC | VanEck |
| Reference rate | CME CF Bitcoin Reference Rate – New York Variant | MarketVector Bitcoin Benchmark Rate |
A bitcoin trust has one holding, so there is no top-ten list. Each issuer publishes the bitcoin held for the trust. Custodian and share count are shown where the issuer page lists them, and gaps are marked Not captured.
ARKB vs HODL tracking, fund against bitcoin
One-year NAV return, benchmark and market price, issuer pages| Period | ARKB NAV | ARKB market | Benchmark | HODL NAV | HODL market | Benchmark |
|---|---|---|---|---|---|---|
| 1 year to Sep 30, 2026 | -26.76% | -27.17% | Not captured | |||
| 1 year to Oct 31, 2026 | -30.30% | -30.20% | -30.26% |
What you actually own
ARKB vs HODL performance
Issuer pages, dates differAll rows come from the issuer pages. The funds are dated differently (ARKB Sep 30, 2026, HODL Oct 31, 2026). NAV returns include fees; market price and benchmark returns are shown where the issuer gave them. “Since inception” starts in different months (ARKB 2024, HODL 2024). Past performance does not guarantee future results.
Growth of a hypothetical $10,000 · NAV total return, 1 year
Derived from issuer NAV total returns (compounded). Fund expenses are already in NAV. Illustration, not a forecast.
ARKB vs HODL yield, dividends and dividend growth
Yield and distribution facts| Measure | ARKB | HODL |
|---|---|---|
| 30-day SEC yield | None | None |
| Distributions | None paid | None paid |
| How the fee is paid | Trust sells bitcoin | Trust sells bitcoin |
| Fee per $10,000 a year | $21 | $20 |
ARKB and HODL have no yield. Bitcoin earns no interest and pays no dividend, so neither trust distributes income, and the whole return comes from the bitcoin price less the fee. Anyone who needs income from a portfolio has to get it elsewhere or sell shares. See what is dividend yield and yield vs total return.
ARKB vs HODL trading and liquidity
Issuer fund pages · Nov 2026Both trusts trade on Cboe BZX. Spreads on the issuer pages were 0.04% for ARKB and not captured for HODL, and a spread of 0.02% is about $20 between the buy and sell price on $100,000. Larger trusts usually trade with tighter spreads, which matters more for frequent traders than for long-term holders. Use limit orders for large trades and avoid the first and last minutes of the session. See creation, redemption and trading for how NAV, premiums and spreads arise.
ARKB vs HODL expense ratio and fees in dollars
As stated by each issuer| Balance | ARKB (0.21%) | HODL (0.20%) | Gap per year |
|---|---|---|---|
| $10,000 | $21 | $20 | $1 |
| $50,000 | $105 | $100 | $5 |
| $100,000 | $210 | $200 | $10 |
The expense ratio is taken from the trust by selling bitcoin, not billed to you. Fees exclude the bid/ask spread, any premium or discount to NAV, brokerage commissions and taxes.
ARKB vs HODL, what each trust holds and how it is valued
Structure, in plain languageARKB · CME CF Bitcoin Reference Rate – New York Variant
ARKB is a grantor trust that holds bitcoin and values it using the CME CF Bitcoin Reference Rate – New York Variant. It was launched in Jan 10, 2024 and charges 0.21%. Custody terms are described in the prospectus and on the issuer page.
HODL · MarketVector Bitcoin Benchmark Rate
HODL is a grantor trust that holds bitcoin and values it using the MarketVector Bitcoin Benchmark Rate. It was launched in Jan 4, 2024 and charges 0.20%. Custody terms are described in the prospectus and on the issuer page.
Custody, valuation and fee terms sit in each prospectus; read them before relying on this summary.
ARKB vs HODL, why yield and returns differ
The fee explains most of the gapBoth trusts hold bitcoin and nothing else, so they follow the same price. What separates them is the fee, the share price, the custodian, the benchmark rate each uses and how heavily each one trades.
A bitcoin trust has no manager choosing securities. Its NAV follows a bitcoin reference rate (CME CF Bitcoin Reference Rate – New York Variant for ARKB and MarketVector Bitcoin Benchmark Rate for HODL), and the main reason it trails that rate is the fee. That is why the tracking comparison above matters more than any single stretch of returns.
How to decide between ARKB and HODL
A step-by-step frameworkStart with what separates them: Both trusts hold bitcoin and nothing else, so they follow the same price. What separates them is the fee, the share price, the custodian, the benchmark rate each uses and how heavily each one trades.
- Step 1 · Asset: both hold bitcoin, so this step is settled.
- Step 2 · Cost: ARKB 0.21% vs HODL 0.20%, or $21 vs $20 a year per $10,000.
- Step 3 · Trading: if you trade often or use options, the larger trust usually has tighter spreads; if you buy and hold, the fee matters more.
- Step 4 · What you own: check whether you already hold bitcoin through another fund with the Diversification Calculator.
Size the position against your whole portfolio. Bitcoin pays no income and can fall sharply, so it usually plays a small, deliberate role.
ARKB vs HODL for Canadian investors
Currency and account typeARKB and HODL are U.S.-listed and trade in U.S. dollars, so buying them from a Canadian account usually involves converting Canadian dollars, which adds a cost on entry and exit. A move in the U.S. dollar also changes your return in Canadian dollars.
Neither trust pays dividends, so U.S. dividend withholding tax is not the main issue here. Tax on gains depends on the account type and your own situation. Confirm the rules for your account with a tax professional. This is general education, not tax advice.
Risks of ARKB and HODL
What can go wrongShared risks
- Bitcoin prices can fall sharply and stay low for long periods; both trusts show one-year NAV declines in the issuer data above.
- Bitcoin pays no interest or dividends, so the whole return depends on price.
- Each trust sells bitcoin to pay its fee, so the bitcoin behind each share declines slowly over time.
- The bitcoin is held by a custodian; see each prospectus for custody, insurance and security terms.
Fund-specific risks
- ARKB and HODL: bitcoin is driven by investor demand, regulation and liquidity, and has swung far more than stocks or gold.
- ARKB: expense ratio 0.21%, net assets $2.24B. HODL: expense ratio 0.20%, net assets $1.07B.
- Both: not registered investment companies under the Investment Company Act of 1940; see each prospectus.
ARKB vs HODL taxes and account placement
General education, not tax adviceIn the United States, bitcoin is generally treated as property for tax purposes, and gains on shares of a physically backed trust are generally capital gains: long-term if you held the shares more than a year, short-term (taxed as ordinary income) otherwise. The same general treatment applies to both ARKB and HODL, but the details depend on your account and situation.
For Canadian account types, see the Canadian section above. Confirm the rules for your account with a tax professional, and read how to build an ETF portfolio.
Other ETFs people compare
For context, not recommendationsInvestors comparing ARKB and HODL often also look at the other spot bitcoin trusts in this group: IBIT, FBTC, GBTC, ARKB, BITB and HODL. See the other bitcoin ETFs comparisons, the gold and silver ETFs and the ETF research hub.
ARKB vs HODL drawdown arithmetic
What a decline means in dollarsRecovery gain = decline ÷ (1 − decline). The scenarios use illustrative declines of 10%, 20% and 30% so you can see what a drop does to each fund. Bitcoin has fallen further than this in the past, so they are not a worst-case figure. See the Position Size Calculator.
Tools to compare ARKB vs HODL
Static weights from this pageIgnores taxes, spreads and holdings differences. ETF Fee Calculator.
Check shared exposure with the Diversification Calculator.
ARKB vs HODL, which fits which job
Characteristics, not recommendationsARKB may suit investors who want…
A mid-sized bitcoin trust at a low fee.
Strengths
- Larger trust: $2.24B against $1.07B
- Backed directly by bitcoin
- Exchange-traded and priced all day
Watch points
- Higher fee: 0.21% against 0.20%
- No income
- Not a complete portfolio
HODL may suit investors who want…
Bitcoin at a low fee and a small share price.
Strengths
- Lower fee: 0.20% against 0.21%
- Backed directly by bitcoin
- Exchange-traded and priced all day
Watch points
- Smaller trust: $1.07B against $2.24B
- No income
- Not a complete portfolio
ARKB vs HODL investor scenarios
Characteristics that fit, not recommendationsARKB vs HODL key terms
Plain-language definitions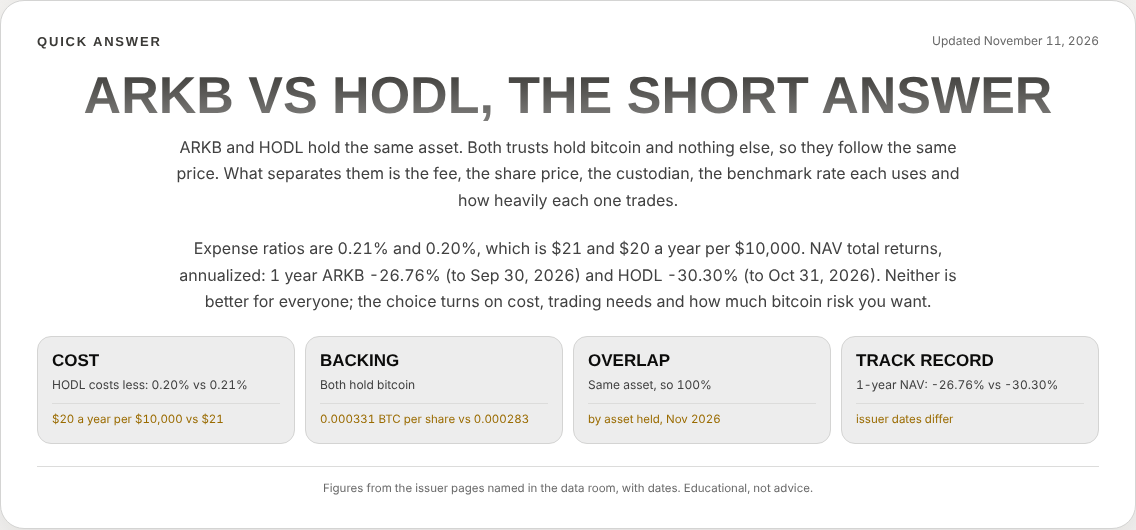
ARKB vs HODL, frequently asked questions
Answers use the figures and dates shown aboveIs ARKB or HODL better?
In the ARKB vs HODL question, neither is better for everyone. ARKB and HODL hold the same asset. Both trusts hold bitcoin and nothing else, so they follow the same price. What separates them is the fee, the share price, the custodian, the benchmark rate each uses and how heavily each one trades.
Expense ratios are 0.21% and 0.20%, which is $21 and $20 a year per $10,000. NAV total returns, annualized: 1 year ARKB -26.76% (to Sep 30, 2026) and HODL -30.30% (to Oct 31, 2026). Neither is better for everyone; the choice turns on cost, trading needs and how much bitcoin risk you want.
ARKB vs HODL, what are the expense ratios?
ARKB charges 0.21% and HODL charges 0.20%, which is $21 and $20 a year per $10,000.
ARKB vs HODL, how much do the funds overlap?
On ARKB vs HODL, they overlap completely. ARKB and HODL both hold only bitcoin, so owning both repeats one position.
ARKB vs HODL, what does each ETF hold?
ARKB holds bitcoin valued at the CME CF Bitcoin Reference Rate – New York Variant. HODL holds bitcoin valued at the MarketVector Bitcoin Benchmark Rate. Neither holds futures or mining stocks.
ARKB vs HODL, which has performed better?
NAV total returns, annualized: 1 year ARKB -26.76% (to Sep 30, 2026) and HODL -30.30% (to Oct 31, 2026). The issuer pages report to different dates, so a winner is not named. Past performance does not guarantee future results.
ARKB vs HODL, how closely do they track bitcoin?
The issuer page for ARKB did not show a benchmark return, so its tracking gap is Not captured; HODL trailed its benchmark by 0.04 percentage points over one year (to Oct 31, 2026) against a fee of 0.20%.
ARKB vs HODL, can I own both?
On ARKB vs HODL, you can, but it adds nothing, because both hold bitcoin. One trust is enough for the exposure.
ARKB vs HODL, do the funds pay dividends?
On ARKB vs HODL, no. ARKB and HODL hold bitcoin, which earns no income, so neither pays a dividend or has a yield.
ARKB vs HODL, how are gains taxed?
On ARKB vs HODL, in the United States, gains on shares of physically backed bitcoin trusts are generally capital gains, long-term after a year. Rules differ by country and account, so confirm with a tax professional. This is general education, not tax advice.
ARKB vs HODL, are they suitable for Canadian investors?
On ARKB vs HODL, both are U.S.-listed and trade in U.S. dollars, so Canadians face currency conversion costs. Neither pays dividends, so dividend withholding is not the main issue. Treatment of gains differs across TFSA, RRSP and taxable accounts. This is general education, not tax advice.
ARKB vs HODL documents and sources
Open the issuer documents before relying on any figureARKB · ARK Invest
HODL · VanEck
Third-party sources
ARK Invest ARKB fund page · VanEck HODL fund page.
Methodology and limits
- ARKB figures come from the ARK Invest fund page and HODL figures from the VanEck fund page.
- Dates are shown beside each figure; the issuer documents are linked below.
- Bitcoin per share: ARKB uses NAV divided by the bitcoin price implied by the FBTC NAV and bitcoin per share, Nov 10, 2026; HODL uses issuer figure of 0.283 bitcoin per 1,000 shares, Nov 9, 2026.
- Overlap is stated by asset held, because a physically backed trust has a single holding.
- Tracking gap is the benchmark return minus the NAV return for the same period, both from the issuer page, and is Not captured where no benchmark return was shown.
- Figures an issuer page does not show are marked Not captured, and nothing was filled from memory or from another fund.
- Return dates differ between some issuers; where they differ no winner is named.
Educational research, not personalized investment, tax or legal advice, and not a recommendation to buy or sell any fund. Investing involves risk, including loss of principal. Past performance does not guarantee future results. Calculators are hypothetical illustrations. Fund data are provided as published by the sources named and may differ from current figures.