Cybersecurity and Defense ETFs
Six security funds comparedA research hub for cybersecurity and defense ETFs and their comparisons: HACK, CIBR, BUG, ITA, XAR and PPA. This page shows what each fund holds, what it costs, how concentrated it is and how much it shares with the others. Every comparison page carries dated figures and sources.
Fund data from Amplify, First Trust, Global X, iShares, State Street and Invesco pages, Sep 30 to Nov 10, 2026 · Educational research, not advice
Cybersecurity and defense ETFs at a glance
Six things to know first- Two themes. Three funds hold cybersecurity companies and three hold aerospace and defense companies.
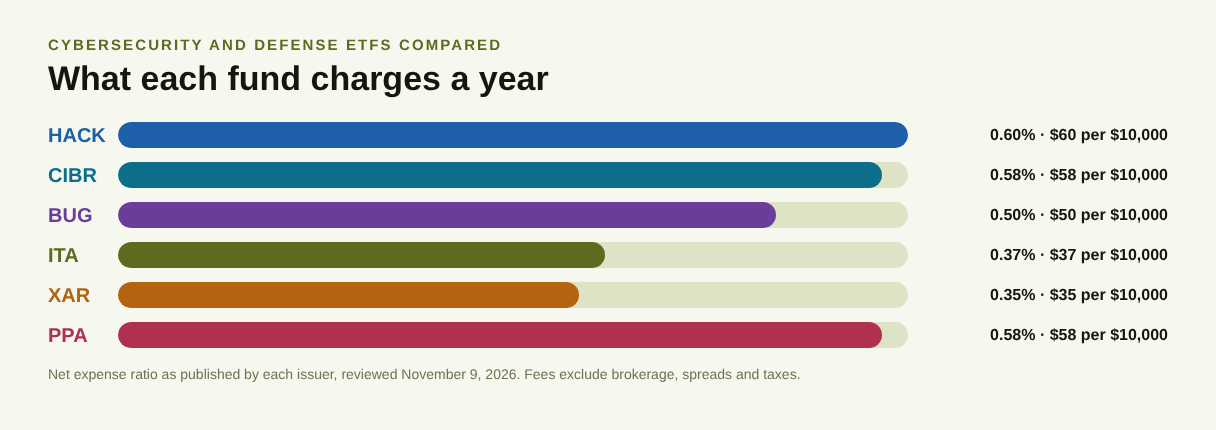
- Cost range. Expense ratios run from 0.35% to 0.60%, which is $250 a year on $100,000.
- Concentration varies. The ten largest holdings are 76% of ITA and 32% of XAR.
- Little cross-overlap. Cyber and defense funds share almost no stocks, apart from two contractors in HACK.
- Different recent paths. Cyber funds returned 31% to 39% in the year to Sep 30, 2026, while defense funds were about flat.
- Little income. SEC yields were below 0.5% where reported.
Core cybersecurity and defense ETFs, the six funds side by side
Dated figures, sources on each comparison| HACK | CIBR | BUG | ITA | XAR | PPA | |
|---|---|---|---|---|---|---|
| Fund | Amplify Cybersecurity ETF | First Trust Nasdaq Cybersecurity ETF | Global X Cybersecurity ETF | iShares U.S. Aerospace & Defense ETF | State Street SPDR S&P Aerospace & Defense ETF | Invesco Aerospace & Defense ETF |
| Theme | Cybersecurity | Cybersecurity | Cybersecurity | Aerospace and defense | Aerospace and defense | Aerospace and defense |
| Index | Nasdaq ISE Cyber Security Select Index | Nasdaq CTA Cybersecurity Index | Indxx Cybersecurity Index | Dow Jones U.S. Select Aerospace & Defense Index | S&P Aerospace & Defense Select Industry Index | SPADE Defense Index |
| Expense ratio | 0.60% | 0.58% | 0.50% | 0.37% | 0.35% | 0.58% |
| Stocks held | 23 | 45 | 30 | 50 | 50 | 68 |
| Ten largest holdings | 51.9% | 54.3% | 61.4% | 76.4% | 32.4% | 61.9% |
| Largest holding | Broadcom 6.3% | CrowdStrike 8.4% | Okta 8.6% | GE Aerospace 21.7% | Karman Holdings 3.5% | GE Aerospace 9.5% |
| 1-year NAV return (Sep 30) | 39.41% | 36.26% | 30.94% | -0.80% | -1.59% | -0.13% |
| 5-year NAV return (Sep 30) | 14.84% | 16.63% | 9.20% | 15.63% | 14.70% | 17.31% |
| Net assets | $3.31B (Nov 9) | $16.36B (Nov 9) | $2.07B (Nov 9) | $12.16B (Nov 9) | $5.26B (Nov 9) | $7.5B (Nov 9) |
| Launched | 2014 | 2015 | 2019 | 2006 | 2011 | 2005 |
Holdings are dated Nov 9, 2026 (HACK Nov 10, 2026) and returns Sep 30, 2026, all from issuer pages. Net assets are issuer figures dated Nov 9, 2026.
XAR is the lowest-cost fund at 0.35%. HACK is the most expensive at 0.60%. Concentration differs more than cost: the ten largest holdings run from 32% of XAR to 76% of ITA.
Cybersecurity and defense ETFs, fund by fund
What each one is and where it differsHACK
Amplify Cybersecurity ETF launched in 2014 as the first cybersecurity ETF. It holds 23 stocks, including the defense contractors Northrop Grumman and General Dynamics, charges 0.60% and had $3.31B on Nov 9, 2026.
CIBR
First Trust Nasdaq Cybersecurity ETF is the largest cyber fund at $16.36B on Nov 9, 2026. It holds 45 stocks, with CrowdStrike, Cisco, Palo Alto Networks and Broadcom each above 7%, and charges 0.58%.
BUG
Global X Cybersecurity ETF holds 30 companies that earn most of their revenue from cybersecurity, so it leaves out the big diversified technology names. It charges 0.50% and had $2.07B on Nov 9, 2026.
ITA
iShares U.S. Aerospace & Defense ETF is the largest defense fund at $12.16B on Nov 9, 2026. It weights 50 stocks by size, so GE Aerospace is 21.7% and RTX 16.5% of the fund. It charges 0.37%.
XAR
State Street SPDR S&P Aerospace & Defense ETF holds 50 stocks at close to equal weights, so its largest position is only 3.5%. It charges 0.35% and had $5.26B on Nov 9, 2026.
PPA
Invesco Aerospace & Defense ETF follows the SPADE Defense Index and holds 68 companies, adding defense technology and space suppliers to the usual contractors. It charges 0.58% and had $7.5B on Nov 9, 2026.
Fund guides for every ETF here
One page per fund, each with the same sectionsHACK
Amplify Cybersecurity ETF. Open the full HACK guide with fees, holdings, yield, returns and taxes.
First Trust · expense ratio 0.58%CIBR
First Trust Nasdaq Cybersecurity ETF. Open the full CIBR guide with fees, holdings, yield, returns and taxes.
Global X · expense ratio 0.50%BUG
Global X Cybersecurity ETF. Open the full BUG guide with fees, holdings, yield, returns and taxes.
iShares · expense ratio 0.37%ITA
iShares U.S. Aerospace & Defense ETF. Open the full ITA guide with fees, holdings, yield, returns and taxes.
State Street · expense ratio 0.35%XAR
State Street SPDR S&P Aerospace & Defense ETF. Open the full XAR guide with fees, holdings, yield, returns and taxes.
Invesco · expense ratio 0.58%PPA
Invesco Aerospace & Defense ETF. Open the full PPA guide with fees, holdings, yield, returns and taxes.
Cybersecurity and defense ETFs, what they hold and what they leave out
Two kinds of security spendingThese six funds follow two industries that both live on security budgets. Cybersecurity funds hold the software and networking companies that protect computer systems. Aerospace and defense funds hold the companies that build aircraft, engines, ships, missiles and satellites, mostly for governments and airlines.
The cybersecurity funds differ in how strictly they define the theme. BUG requires companies to earn at least half of their revenue from cybersecurity, so 97% of it sits in security software. CIBR admits large networking and IT services companies, which make up about 47% of the fund. HACK holds a short list of 23 names and includes two defense contractors.
The defense funds differ in weighting. ITA weights by size, so two companies are 38% of the fund. XAR spreads its money almost evenly over 50 stocks, which gives small space and drone companies 12% of the fund. PPA holds the longest list and reaches into defense technology and industrial suppliers.
When a cybersecurity fund fits: you want software companies whose sales depend on security spending. When a defense fund fits: you want aerospace manufacturers and military contractors. Neither is a broad market holding. These describe what the funds hold, not recommendations.
Index rules, why similar funds differ
Definition and weighting decide the resultInside each theme the three funds share many holdings, but the index rules lead to different portfolios. Among the cyber funds, overlap runs from 44% for CIBR and BUG to 64% for HACK and BUG. Among the defense funds it runs from 47% for XAR and PPA to 70% for ITA and PPA.
Weighting is the main cause on the defense side. Over five years to Sep 30, 2026, the size-weighted ITA returned 15.63% a year, the equal-weighted XAR 14.70% and PPA 17.31%. On the cyber side the definition matters more: over the same five years CIBR returned 16.63% a year, HACK 14.84% and the pure-play BUG 9.20%.
The table below groups each fund’s holdings by main business, using one scheme for all six funds.
| Fund | Largest industry groups | Holdings date |
|---|---|---|
| HACK | Cybersecurity software 67.7%, Networking and infrastructure 22.4%, Defense primes 9.9% | Nov 10, 2026 |
| CIBR | Cybersecurity software 53.5%, Networking and infrastructure 27.8%, IT services and platforms 18.8% | Nov 9, 2026 |
| BUG | Cybersecurity software 97.2%, Networking and infrastructure 2.8% | Nov 9, 2026 |
| ITA | Aerospace and engines 52.1%, Defense primes 37.9%, Components and materials 6.2% | Nov 9, 2026 |
| XAR | Aerospace and engines 44.0%, Defense primes 32.4%, Space and drones 12.1% | Nov 9, 2026 |
| PPA | Aerospace and engines 41.8%, Defense primes 40.0%, Components and materials 9.0% | Nov 9, 2026 |
Industry groups are assigned by this site from each stock’s main business, so they are comparable across funds but will not match an issuer’s own sector table. Cash and futures are left out.
Cybersecurity and defense ETF returns, same dates for all six
NAV total return to Sep 30, 2026All six issuers report returns to Sep 30, 2026, so the table compares like with like. Figures are annualized NAV total returns, net of fees.
| Fund | 1 year | 3 years | 5 years | 10 years | Since inception |
|---|---|---|---|---|---|
| HACK | 39.41% | 33.01% | 14.84% | 16.21% | 14.60% |
| CIBR | 36.26% | 31.92% | 16.63% | 18.51% | 16.33% |
| BUG | 30.94% | 23.96% | 9.20% | Not captured | 17.84% |
| ITA | -0.80% | 25.92% | 15.63% | 13.47% | 12.03% |
| XAR | -1.59% | 27.89% | 14.70% | 15.59% | 17.20% |
| PPA | -0.13% | 25.37% | 17.31% | 15.79% | 12.89% |
Source: issuer fund pages (Amplify, First Trust, Global X, iShares, State Street and Invesco). BUG launched in 2019, so it has no 10-year figure. Past performance does not guarantee future results.
The two themes went different ways over the last year. The cyber funds returned between 30.94% and 39.41%, while the three defense funds were roughly flat, between -1.59% and -0.13%. Over three years the gap narrows, and over ten years all five funds with a record returned between 13.47% and 18.51% a year.
That pattern is a reason to be careful with one-year numbers. Read how to measure investment growth and P/E ratio explained before treating any figure as a forecast.
Cybersecurity and defense ETF yield and dividends
Small payoutsNeither theme is an income play. The 30-day SEC yield was 0.46% for ITA and 0.36% for PPA, since defense contractors pay dividends, and 0.05% for CIBR and -0.25% for BUG, since most security software companies pay none. HACK and XAR did not show a comparable figure on the pages used.
A negative SEC yield, as BUG shows, means the fund’s costs are larger than the dividends its stocks pay. ITA and XAR pay quarterly and BUG twice a year.
See what is dividend yield and yield vs total return for how income and price change add up.
Cybersecurity and defense ETF holdings and overlap
Matched stock by stock on tickerEvery comparison page matches the two funds’ full holdings by ticker and adds up the smaller of the two weights for each stock both hold.
Funds inside a theme overlap by 44% to 70%. Across the two themes the overlap is close to zero, with one exception: HACK shares 6% to 10% with the defense funds because it holds Northrop Grumman and General Dynamics.
| Comparison | Portfolio overlap |
|---|---|
| HACK vs CIBR | 55% |
| HACK vs BUG | 64% |
| HACK vs ITA | 10% |
| HACK vs XAR | 6% |
| HACK vs PPA | 10% |
| CIBR vs BUG | 44% |
| CIBR vs ITA | 0% |
| CIBR vs XAR | 0% |
| CIBR vs PPA | 2% |
| BUG vs ITA | 0% |
| BUG vs XAR | 0% |
| BUG vs PPA | 0% |
| ITA vs XAR | 52% |
| ITA vs PPA | 70% |
| XAR vs PPA | 47% |
Overlap is an estimate from issuer holdings dated Nov 9, 2026 (HACK Nov 10, 2026). Foreign shares are matched on the exchange ticker each issuer reports. Cash and futures are excluded.
Check overlap with your core fund too. GE Aerospace, RTX, Boeing, Broadcom and Cisco are also large holdings in S&P 500 funds. Test your own mix with the Diversification Calculator.
Cybersecurity and defense ETF comparison, all fifteen pairs
Head to head, same formatEach page below puts two funds side by side on cost, holdings overlap, industry mix, concentration, returns and trading. Every figure carries its date, and the data room at the bottom of each page lists the source and grade of each number.
HACK vs CIBR
Two cybersecurity funds with 55% overlap and fees of 0.60% and 0.58%.
Read the comparisonHACK vs BUG
Two cybersecurity funds with 64% overlap and fees of 0.60% and 0.50%.
Read the comparisonHACK vs ITA
Cybersecurity against aerospace and defense, with 10% overlap.
Read the comparisonHACK vs XAR
Cybersecurity against aerospace and defense, with 6% overlap.
Read the comparisonHACK vs PPA
Cybersecurity against aerospace and defense, with 10% overlap.
Read the comparisonCIBR vs BUG
Two cybersecurity funds with 44% overlap and fees of 0.58% and 0.50%.
Read the comparisonCIBR vs ITA
Cybersecurity against aerospace and defense, with 0% overlap.
Read the comparisonCIBR vs XAR
Cybersecurity against aerospace and defense, with 0% overlap.
Read the comparisonCIBR vs PPA
Cybersecurity against aerospace and defense, with 2% overlap.
Read the comparisonBUG vs ITA
Cybersecurity against aerospace and defense, with 0% overlap.
Read the comparisonBUG vs XAR
Cybersecurity against aerospace and defense, with 0% overlap.
Read the comparisonBUG vs PPA
Cybersecurity against aerospace and defense, with 0% overlap.
Read the comparisonITA vs XAR
Two aerospace and defense funds with 52% overlap and fees of 0.37% and 0.35%.
Read the comparisonITA vs PPA
Two aerospace and defense funds with 70% overlap and fees of 0.37% and 0.58%.
Read the comparisonXAR vs PPA
Two aerospace and defense funds with 47% overlap and fees of 0.35% and 0.58%.
Read the comparisonHow to compare cybersecurity and defense ETFs
A seven-point checklist- 1. Theme definition Check how strictly the index defines the theme. BUG is pure-play, while CIBR and PPA cast a wider net.
- 2. Weighting Size-weighted funds such as ITA follow a few giants. Equal-weighted funds such as XAR lean on smaller companies.
- 3. Top holdings The largest position runs from 3.5% in XAR to 21.7% in ITA.
- 4. Cost Expense ratios run from 0.35% to 0.60% here. Add the bid/ask spread when you trade.
- 5. Overlap Compare with your core fund as well as with the other funds in the theme.
- 6. Size and trading Issuers reported 30-day median spreads from 0.06% to 0.13%. Larger funds usually trade more cheaply.
- 7. Dates and sources Compare returns only when the periods match, as they do on this page.
Start with how to research an ETF if the terms are new, and size any theme fund inside your whole allocation with asset allocation explained.
Cybersecurity and defense ETF fees and what you really pay
Cost beyond the expense ratioOn a $100,000 balance, 0.35% is $350 a year, 0.50% is $500 and 0.60% is $600. The two cheapest funds are the defense funds XAR and ITA, and the cyber funds cost between 0.50% and 0.60%. Use the ETF Fee Calculator to turn a fee gap into dollars over time.
Trading costs come from the bid/ask spread and any premium or discount to NAV. Issuer pages showed 30-day median spreads of 0.06% for ITA and BUG, 0.07% for CIBR and PPA, 0.10% for XAR and 0.13% for HACK. Use limit orders for larger amounts.
A cheaper fund is not automatically the better holding if it owns something different from what you want. Start with the holdings, then use the fee to choose between funds that hold similar things.
Which cybersecurity and defense ETFs suit which investor
Matching the fund to the planYou want pure cybersecurity companies: BUG holds only companies that earn most of their revenue from security. Compare it on the CIBR vs BUG page.
You want the largest cyber fund: CIBR is the biggest and adds large networking names. See HACK vs CIBR.
You want the big defense and aerospace names: ITA is weighted toward GE Aerospace and RTX. Read ITA vs XAR.
You want smaller defense and space companies to count: XAR weights its stocks about equally. See XAR vs PPA.
You are choosing between the two themes: CIBR vs ITA shows how little they share. Size any position against your whole portfolio with the Diversification Calculator.
Common mistakes with cybersecurity and defense ETFs
Easy ones to avoidAssuming all cyber funds match. CIBR and BUG share only 44% of their weight.
Ignoring concentration. Two stocks are 38% of ITA.
Owning two funds in one theme. ITA and PPA share 70% of their weight, so the second adds little.
Chasing last year. Cyber funds led over one year and defense funds led BUG over five. Leadership changes.
Buying on headlines. News about a breach or a conflict is usually in prices quickly, and budgets move slowly.
Making a theme the core. These funds hold one industry each, so they belong beside a diversified core.
Risks of cybersecurity and defense ETFs
What steady demand does not removeGrowth is priced in
Security software companies often trade at high multiples, so prices can fall sharply when growth slows.
One large customer
Defense contractors depend on government spending, contract awards and politics.
A few stocks drive results
Size-weighted funds can hold a fifth of their money in one company.
Owning dozens of companies inside one theme lowers single-company risk, but it does not remove theme risk. The funds can fall together and the recovery can take years. Past gains are not a limit on future losses.
Cybersecurity and defense ETFs for Canadian investors
Currency, withholding tax and accountsU.S.-listed funds such as HACK, CIBR, BUG, ITA, XAR and PPA trade in U.S. dollars. Buying them from a Canadian account usually involves converting Canadian dollars, which adds a cost, and a move in the U.S. dollar also changes your return in Canadian dollars.
Dividends paid to Canadian holders are generally subject to U.S. withholding tax, with treatment that depends on the account type. These funds pay little income, so the effect is small.
Confirm the rules for your accounts with a qualified tax professional, and see how to build an ETF portfolio for how a theme fund fits inside an allocation.
Tools for comparing cybersecurity and defense ETFs
Run your own numbersHow cybersecurity and defense ETFs are researched here
Sources and datesFigures come from the issuer pages for each fund: Amplify for HACK, First Trust for CIBR, Global X for BUG, iShares for ITA, State Street for XAR and Invesco for PPA. Fund facts and holdings are dated Nov 9, 2026 (HACK holdings Nov 10, 2026) and returns Sep 30, 2026. Gaps are shown as Not captured, and nothing was filled from memory or from another fund.
Overlap sums the smaller weight of each ticker held by both funds and is an estimate. Industry groups are assigned by this site so every fund uses the same labels. The pages are educational research, not personal advice, and they do not recommend any fund.
Cybersecurity and defense ETFs, questions answered
Plain answersWhat are cybersecurity and defense ETFs?
They are funds that hold companies in one of two security industries. Cybersecurity ETFs hold software and networking companies that protect computer systems, and defense ETFs hold aerospace manufacturers and military contractors. This page compares six of them: HACK, CIBR, BUG, ITA, XAR and PPA.
What is the difference between CIBR and HACK?
Both are cybersecurity funds. CIBR holds 45 stocks, is the larger fund at $16.36B and charges 0.58%. HACK holds 23 stocks, includes two defense contractors and charges 0.60%. They overlap by about 55%.
What is the difference between ITA and XAR?
Both hold 50 U.S. aerospace and defense stocks. ITA weights them by size, so its ten largest holdings are 76% of the fund, and XAR weights them about equally, so its ten largest are 32%. ITA charges 0.37% and XAR 0.35%. They overlap by about 52%.
Which cybersecurity ETF has the lowest cost?
BUG lists the lowest expense ratio of the three cyber funds at 0.50%, followed by CIBR at 0.58% and HACK at 0.60%.
Which defense ETF has the lowest cost?
XAR lists the lowest expense ratio of the three defense funds at 0.35%, followed by ITA at 0.37% and PPA at 0.58%.
Do cybersecurity and defense ETFs pay dividends?
Only small amounts. SEC yields on the issuer pages were below 0.5%, and BUG reported a slightly negative figure.
Do cybersecurity and defense ETFs overlap?
Hardly at all. Five of the six funds share almost nothing across the two themes. HACK is the exception, because it holds Northrop Grumman and General Dynamics.
Are cybersecurity and defense ETFs risky?
Yes. Each holds a single industry. Global X reports a standard deviation of 38.6% for BUG, and iShares reports 18.57% over three years for ITA, so the cyber fund has been about twice as volatile.
Should I own more than one fund in a theme?
Usually one is enough. Funds inside a theme share 44% to 70% of their weight.
Are these ETFs a good fit for Canadian investors?
U.S.-listed funds can work, but you face currency conversion and U.S. withholding tax on the small dividends, and treatment depends on the account. Confirm the details with a qualified tax professional.
Educational research, not personalized investment, tax or legal advice, and not a recommendation to buy or sell any fund. Investing involves risk, including loss of principal. Past performance does not guarantee future results. Fund data are provided as published by the sources named and may differ from current figures.