High-Yield Dividend ETFs
Six dividend funds comparedA research hub for high-yield dividend ETFs and their comparisons: DVY, SPYD, SCHD, VYM, HDV and VIG. This page shows what each fund owns, what each costs, how each has performed and how the fifteen pairs compare. Every comparison page carries dated figures and sources.
Fund data from iShares, State Street, Schwab and Vanguard pages, Sep 30 to Nov 10, 2026 · Educational research, not advice
High-yield dividend ETFs at a glance
Six things to know first- Index funds. All six track an index and hold U.S. dividend stocks, and all pay quarterly.
- Cost range. Expense ratios run from 0.04% to 0.38%, which is $340 a year on $100,000.
- Three styles. DVY, SPYD, VYM and HDV screen for yield, SCHD for quality and VIG for dividend growth.
- Yield differs a lot. Trailing yields run from 1.49% for VIG to 4.12% for SPYD.
- Sectors differ most. SPYD is about 25% real estate, DVY about 48% financials and utilities, and VIG is the most technology-heavy.
- Tax is mixed. Distributions can include qualified dividends, ordinary dividends and return of capital.
High-yield dividend ETFs, the six funds side by side
Dated figures, sources on each comparison| DVY | SPYD | SCHD | VYM | HDV | VIG | |
|---|---|---|---|---|---|---|
| Fund | iShares Select Dividend ETF | State Street SPDR Portfolio S&P 500 High Dividend ETF | Schwab U.S. Dividend Equity ETF | Vanguard High Dividend Yield ETF | iShares Core High Dividend ETF | Vanguard Dividend Appreciation ETF |
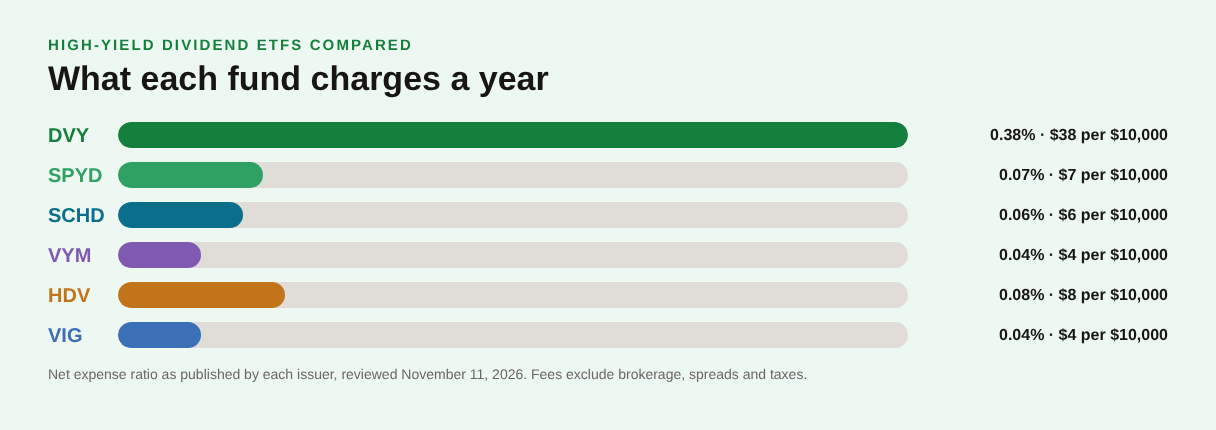
| Expense ratio | 0.38% | 0.07% | 0.06% | 0.04% | 0.08% | 0.04% |
| Cost per $10,000 a year | $38 | $7 | $6 | $4 | $8 | $4 |
| Net assets (date) | $23.68B (Nov 10) | $7.79B (Nov 10) | $119.9B (Nov 6) | $83.34B (Nov 2) | $16.18B (Nov 6) | $115.8B (Nov 5) |
| Trailing yield | 3.51% (Sep 30, 2026) | 4.12% (Nov 9, 2026) | 3.24% (Sep 30, 2026) | 2.24% (Nov 2, 2026) | 3.05% (Sep 30, 2026) | About 1.49% (Sep 28, 2026) |
| 30-day SEC yield | 3.66% (Sep 30, 2026) | 4.26% (Nov 9, 2026) | 3.12% (Nov 5, 2026) | Not captured | 3.51% (Sep 30, 2026) | 1.43% (Oct 31, 2026) |
| Number of holdings | 98 | 77 | 102 | 593 | 73 | 333 |
| Top ten share of fund | 19.6% (Nov 9) | 16.3% (Nov 10) | 41.2% (Nov 5) | 26.2% (Sep 30) | 55.8% (Sep 30) | 34.5% (Sep 30) |
| Largest sector | Financials 25.5% | Real Estate 25.0% | Consumer staples 20.0% | Financials 20.4% | Consumer staples 26.7% | Information technology 26.7% |
| Index | Dow Jones U.S. Select Dividend Index | S&P 500 High Dividend Index | Dow Jones U.S. Dividend 100 Index | FTSE High Dividend Yield Index | Morningstar Dividend Yield Focus Index | S&P U.S. Dividend Growers Index |
| Exchange | NASDAQ | NYSE Arca | NYSE Arca | NYSE Arca | NYSE Arca | NYSE Arca |
| Launched | Nov 3, 2003 | Oct 21, 2015 | Oct 20, 2011 | Nov 10, 2006 | Mar 29, 2011 | Apr 21, 2006 |
Figures come from each issuer page, with the date beside each number. Net assets, yields and holdings are dated differently by each issuer, and VYM net assets come from a third-party page dated Nov 2. Trailing yields and SEC yields use different definitions, so read them as a range rather than a ranking.
VYM and VIG are the lowest-cost funds at 0.04%. DVY is the most expensive at 0.38%. All six hold U.S. dividend stocks and track an index, so the differences come from how each index picks and weights stocks, what the fund holds and what it costs.
High-yield dividend ETFs, fund by fund
What each one is and where it differsDVY
iShares Select Dividend ETF launched in 2003 and held $23.68B on Nov 10, 2026. It charges 0.38%, tracks the Dow Jones U.S. Select Dividend Index and holds 98 stocks, with financials at 25.5% and utilities at 22.6% of the fund.
SPYD
State Street SPDR Portfolio S&P 500 High Dividend ETF launched in 2015 and held $7.79B on Nov 10, 2026. It charges 0.07% and tracks the S&P 500 High Dividend Index, the 80 highest-yielding S&P 500 stocks, with real estate at about 25% of the fund.
SCHD
Schwab U.S. Dividend Equity ETF launched in 2011 and held $119.9B on Nov 6, 2026. It charges 0.06% and tracks the Dow Jones U.S. Dividend 100 Index, about 100 companies chosen for dividend quality, with its ten largest holdings near 41% of the fund.
VYM
Vanguard High Dividend Yield ETF launched in 2006 and held $83.34B on Nov 2, 2026 according to a third-party page. It charges 0.04% and tracks the FTSE High Dividend Yield Index, holding 593 stocks with its ten largest near 26% of the fund.
HDV
iShares Core High Dividend ETF launched in 2011 and held $16.18B on Nov 6, 2026. It charges 0.08% and tracks the Morningstar Dividend Yield Focus Index, with about 73 stocks and consumer staples and energy making up about half of the fund.
VIG
Vanguard Dividend Appreciation ETF launched in 2006 and held $115.8B on Nov 5, 2026. It charges 0.04% and tracks the S&P U.S. Dividend Growers Index, 333 companies with a record of raising dividends, and pays the lowest yield of the six.
Fund guides for every ETF here
One page per fund, each with the same sectionsSCHD
Schwab U.S. Dividend Equity ETF. Open the full SCHD guide with fees, holdings, yield, returns and taxes.
iShares · expense ratio 0.38%DVY
iShares Select Dividend ETF. Open the full DVY guide with fees, holdings, yield, returns and taxes.
State Street · expense ratio 0.07%SPYD
State Street SPDR Portfolio S&P 500 High Dividend ETF. Open the full SPYD guide with fees, holdings, yield, returns and taxes.
How these dividend indexes pick stocks
Yield screens, quality screens and growth screensAll six funds track an index, but the indexes answer different questions. DVY, SPYD, VYM and HDV start from yield: they pick stocks that pay high dividends compared with their price. SCHD starts from quality: it selects companies by the strength of their finances and dividend record and leaves out the very highest yields. VIG starts from growth: it holds companies that have raised dividends for years, which usually means a lower starting yield.
The method shapes the portfolio. A pure yield screen tends to pick up sectors that pay out most of their earnings, such as utilities, real estate, financials, energy and consumer staples. That is why SPYD holds about 25% in real estate, DVY about 48% in financials and utilities together, and HDV about half in consumer staples and energy. VIG holds far more technology and health care, which is why its yield is the lowest.
A high yield can also mean a falling share price or a dividend at risk. The yield on this page is a description of what a fund pays, not a promise of future income, and it does not show total return.
When each style fits: a yield screen suits someone who wants more cash flow now and accepts a narrower mix, a quality screen suits someone who wants income with stronger financials, and a growth screen suits someone who prefers rising dividends over a high starting yield. These describe the funds, not what to buy.
Dividend ETF sector weights, where the yield comes from
Eight largest sectors, dates differ by issuer| Sector | DVY | SPYD | SCHD | VYM | HDV | VIG |
|---|---|---|---|---|---|---|
| Financials | 25.5% | 13.6% | 9.1% | 20.4% | 4.7% | 21.0% |
| Utilities | 22.6% | 11.0% | 0.1% | 5.4% | 11.4% | 2.7% |
| Real Estate | 0.0% | 25.0% | 0.0% | 0.0% | 0.0% | 0.0% |
| Consumer Staples | 13.9% | 13.1% | 20.0% | 8.5% | 26.7% | 9.2% |
| Energy | 9.7% | 5.2% | 15.4% | 10.1% | 23.1% | 3.6% |
| Health Care | 5.5% | 4.4% | 19.2% | 13.4% | 13.9% | 18.6% |
| Technology | 3.0% | 3.8% | 12.2% | 14.3% | 0.4% | 26.7% |
| Industrials | 1.9% | 5.5% | 11.3% | 13.6% | 2.7% | 11.4% |
Source: issuer pages. Dates are Nov 10 for DVY (Nov 9 sector data) and SPYD, Nov 5 for SCHD, Nov 6 for HDV and Sep 30 for VYM and VIG. Sector names differ slightly between providers, and a sector missing from a fund page is shown as 0.0%.
The sector table is where these funds differ most. SPYD holds 25.0% in real estate against 0.0% for SCHD, while SCHD holds 19.2% in health care and 12.2% in technology. VIG holds 26.7% in technology, the most of the six, and VYM spreads across financials, technology and industrials.
Because these are all U.S. stock funds, a sector tilt matters. A fund with a heavy weight in one sector, such as real estate or utilities, can move differently from the broad market when interest rates change. Read asset allocation explained before sizing a position.
High-yield dividend ETF returns, same date for all six
NAV total return to Sep 30, 2026All six issuers report standardized returns to Sep 30, 2026, so the table compares like with like. Figures are annualized NAV total returns, net of fees. Since-launch figures start in different years, from 2003 for DVY to 2015 for SPYD, so they are not comparable with each other.
| Fund | 1 year | 3 years | 5 years | 10 years | Since launch |
|---|---|---|---|---|---|
| DVY | 10.80% | 16.35% | 9.68% | 9.76% | 8.74% |
| SPYD | 7.83% | 13.99% | 7.70% | 7.79% | 8.81% |
| SCHD | 23.36% | 15.44% | 9.48% | 12.44% | 13.11% |
| VYM | 12.72% | 17.67% | 11.63% | 11.28% | 9.13% |
| HDV | 17.86% | 16.06% | 12.10% | 9.43% | 10.61% |
| VIG | 9.77% | 16.51% | 10.72% | 12.86% | 9.99% |
Source: issuer fund pages (iShares, State Street, Schwab and Vanguard). Past performance does not guarantee future results.
Over one year SCHD (23.36%) led the group, followed by VYM (12.72%), HDV (17.86%), DVY (10.80%), VIG (9.77%) and SPYD (7.83%). Over three years HDV, VYM and VIG were within about 2 points of each other while SPYD returned 13.99%. The order changes by period, which is why one window should not drive a decision.
Read how to measure investment growth and nominal vs real values before treating any of these numbers as a forecast.
High-yield dividend ETF yield, how to read the numbers
A high yield is not a high returnThe issuer pages show trailing yields of 3.51% (Sep 30, 2026) for DVY, 4.12% (Nov 9, 2026) for SPYD, 3.24% (Sep 30, 2026) for SCHD, 2.24% (Nov 2, 2026) for VYM, 3.05% (Sep 30, 2026) for HDV and About 1.49% (Sep 28, 2026) for VIG, each dated differently by its issuer.
The 30-day SEC yield follows a standard formula and showed 4.26% for SPYD, 3.66% for DVY, 3.51% for HDV, 3.12% for SCHD and 1.43% for VIG. The VYM page used here did not show one. SPYD and DVY sit at the top of the group on both measures, and VIG is far below the rest because it holds dividend growers rather than high payers.
A higher yield buys more income now, but it can come with a narrower mix and more risk of dividend cuts. Compare the yield with the NAV total return before judging a fund. See what is dividend yield, yield vs total return and high dividend yield.
Dividend ETF holdings and overlap
Top ten holdings and sector weightsTop-ten overlap sums the smaller weight of each holding that appears in both funds’ ten largest positions. It is a narrow measure, and it shows low numbers here because dividend funds hold different stocks at the top. Sector overlap sums the smaller weight of each sector in both funds, which shows how alike two portfolios are beyond the top ten.
The highest top-ten overlap is 21.0% for SCHD and HDV, and most pairs share little or nothing among their ten largest positions. By sector the most similar pair is VIG and VYM at 81%, and the least similar is VIG and HDV at 42%.
| Comparison | Top-10 overlap | Sector overlap | Fee gap |
|---|---|---|---|
| DVY vs SPYD | 4.5% | 69% | 0.31 pts |
| DVY vs SCHD | 0.0% | 55% | 0.32 pts |
| DVY vs VYM | 0.0% | 68% | 0.34 pts |
| DVY vs HDV | 4.0% | 60% | 0.30 pts |
| DVY vs VIG | 0.0% | 54% | 0.34 pts |
| SPYD vs SCHD | 0.0% | 52% | 0.01 pts |
| SPYD vs VYM | 0.0% | 59% | 0.03 pts |
| SPYD vs HDV | 0.0% | 53% | 0.01 pts |
| SPYD vs VIG | 0.0% | 50% | 0.03 pts |
| SCHD vs VYM | 1.6% | 75% | 0.02 pts |
| SCHD vs HDV | 21.0% | 69% | 0.02 pts |
| SCHD vs VIG | 0.0% | 68% | 0.02 pts |
| VIG vs VYM | 15.6% | 81% | 0.00 pts |
| VIG vs HDV | 5.0% | 42% | 0.04 pts |
| VYM vs HDV | 6.4% | 57% | 0.04 pts |
Use overlap before you add a second fund. Two yield funds can look different at the top and still lean on the same sectors. Test your whole mix with the Diversification Calculator.
High-yield dividend ETF comparison, fifteen pairs
Head to head, same formatEach page below puts two funds side by side on cost, what each owns, overlap, yield, returns against each index, trading and taxes. Every figure carries its date, and the data room at the bottom of each page lists the source and grade of each number. The first nine pairs are new on this page; the last six were published earlier in the Dividend category.
DVY vs SPYD
Fees of 0.38% and 0.07%, top-ten overlap of 4.5% and sector overlap of about 69%.
Read the comparisonDVY vs SCHD
Fees of 0.38% and 0.06%, top-ten overlap of 0.0% and sector overlap of about 55%.
Read the comparisonDVY vs VYM
Fees of 0.38% and 0.04%, top-ten overlap of 0.0% and sector overlap of about 68%.
Read the comparisonDVY vs HDV
Fees of 0.38% and 0.08%, top-ten overlap of 4.0% and sector overlap of about 60%.
Read the comparisonDVY vs VIG
Fees of 0.38% and 0.04%, top-ten overlap of 0.0% and sector overlap of about 54%.
Read the comparisonSPYD vs SCHD
Fees of 0.07% and 0.06%, top-ten overlap of 0.0% and sector overlap of about 52%.
Read the comparisonSPYD vs VYM
Fees of 0.07% and 0.04%, top-ten overlap of 0.0% and sector overlap of about 59%.
Read the comparisonSPYD vs HDV
Fees of 0.07% and 0.08%, top-ten overlap of 0.0% and sector overlap of about 53%.
Read the comparisonSPYD vs VIG
Fees of 0.07% and 0.04%, top-ten overlap of 0.0% and sector overlap of about 50%.
Read the comparisonSCHD vs VYM
Fees of 0.06% and 0.04%, top-ten overlap of 1.6% and sector overlap of about 75%.
Read the comparisonSCHD vs HDV
Fees of 0.06% and 0.08%, top-ten overlap of 21.0% and sector overlap of about 69%.
Read the comparisonSCHD vs VIG
Fees of 0.06% and 0.04%, top-ten overlap of 0.0% and sector overlap of about 68%.
Read the comparisonVIG vs VYM
Fees of 0.04% and 0.04%, top-ten overlap of 15.6% and sector overlap of about 81%.
Read the comparisonVIG vs HDV
Fees of 0.04% and 0.08%, top-ten overlap of 5.0% and sector overlap of about 42%.
Read the comparisonVYM vs HDV
Fees of 0.04% and 0.08%, top-ten overlap of 6.4% and sector overlap of about 57%.
Read the comparisonHow to compare high-yield dividend ETFs
A seven-point checklist- 1. Index method Decide whether you want a yield screen, a quality screen or a growth screen, because that drives sectors and yield.
- 2. Cost Expense ratios run from 0.04% to 0.38% here, and a higher fee comes out of the same dividends.
- 3. Total return Compare NAV total return with the fund’s own index, not only the yield.
- 4. Yield definition Check the date and definition behind a yield figure, and compare the SEC yield with the trailing yield.
- 5. Sector mix Check the largest sectors, because a heavy weight in one sector changes how the fund behaves.
- 6. Overlap Check shared holdings and sector overlap before owning two of these, or one alongside a stock index fund.
- 7. Dates and sources Compare figures only when the dates match, as the returns do on this page.
Start with how to research an ETF if the terms are new, and size any income position inside your whole allocation with asset allocation explained.
Dividend ETF fees and what you really pay
Cost beyond the expense ratioOn a $100,000 balance, 0.04% is $40 a year, 0.07% is $70 and 0.38% is $380. DVY costs about nine times as much as VYM or VIG, so the fee gap matters more here than in most index fund pairs. Use the ETF Fee Calculator to turn a fee gap into dollars over time.
Trading costs come from the bid/ask spread and from any premium or discount to NAV. The issuer pages showed 30-day median spreads of 0.01%% to 0.03%% where reported (VIG 0.01%%, SPYD 0.02%%, SCHD, DVY and HDV 0.03%%; the VYM page used here did not show one). Use limit orders for larger amounts.
Someone who trades often may value the deepest market more than the lowest fee, while a long-term holder usually gains more from the lower fee. Both are reasonable positions.
Which dividend ETFs suit which investor
Matching the fund to the planYou want dividend exposure at the lowest fee: VYM and VIG at 0.04%, or SCHD at 0.06%. See SCHD vs VYM and VIG vs VYM.
You want the highest current yield: SPYD and DVY sit at the top of the group. Read DVY vs SPYD and note the fee gap of 0.31 points.
You prefer dividend quality: SCHD screens for it. See DVY vs SCHD and SPYD vs SCHD.
You prefer rising dividends over a high yield: VIG holds dividend growers. See DVY vs VIG and SPYD vs VIG.
You already own stock index funds: these funds repeat many of the same large companies, so check shared holdings with the Diversification Calculator and size any position against your whole portfolio.
Common mistakes with high-yield dividend ETFs
Easy ones to avoidChasing the highest yield. A high yield can mean a falling price or a dividend at risk, and the highest-yielding fund is not always the best total return.
Comparing yields from different dates. The issuers report yields on different dates and definitions, so check them before ranking.
Ignoring sector concentration. A fund with 25% in one sector behaves differently from the broad market.
Owning two funds that overlap. Two yield funds can lean on the same sectors and add a second fee.
Ignoring the fee gap. DVY costs 0.38% against 0.04% for VYM, which is $340 a year more on $100,000.
Judging on one year. Dividend funds lead in some years and lag in others, and the order changes by period.
Risks of high-yield dividend ETFs
What a high yield does not removePayouts can fall
Companies can cut or stop paying, and a high yield can signal that a stock has fallen or that a dividend is at risk.
Sectors lean hard
Yield screens can put a quarter of a fund in one sector, such as real estate, financials or utilities.
The stocks still fall
These funds hold stocks, so a market decline hits NAV, and dividends do not offset a large drop.
Interest rates also matter. Rate-sensitive sectors such as utilities and real estate can move sharply when rates change. Read each prospectus for the index method, the concentration risks and the tax treatment before buying.
High-yield dividend ETFs for Canadian investors
Currency and accountsU.S.-listed funds such as DVY, SPYD, SCHD, VYM, HDV and VIG trade in U.S. dollars. Buying them from a Canadian account usually involves converting Canadian dollars, which adds a cost, and a move in the U.S. dollar also changes your return in Canadian dollars.
Quarterly distributions from U.S. funds can face U.S. withholding tax depending on the account type, and the split between income types varies from year to year. How dividends and gains are taxed depends on the account and your own situation.
Confirm the rules for your accounts with a qualified tax professional, and see how to build an ETF portfolio for how a dividend position fits inside an allocation.
Tools for comparing dividend ETFs
Run your own numbersHow high-yield dividend ETFs are researched here
Sources and datesFigures come from the issuer pages for each fund: iShares for DVY and HDV, State Street for SPYD, Schwab for SCHD and Vanguard for VYM and VIG. Fund facts are dated Nov 2 to Nov 10, 2026 and returns Sep 30, 2026. VYM net assets and trailing yield come from a third-party page dated Nov 2. Gaps are shown as Not captured, and nothing was filled from memory or from another fund.
Top-ten overlap is the sum of the smaller weight of each shared holding among the ten largest holdings published for each fund. Sector overlap is the sum of the smaller sector weight in each fund. The pages are educational research, not personal advice, and they do not recommend any fund.
High-yield dividend ETFs, questions answered
Plain answersWhat are high-yield dividend ETFs?
High-yield dividend ETFs hold U.S. stocks that pay dividends and track an index that screens for yield, quality or dividend growth. This page compares six of them: DVY, SPYD, SCHD, VYM, HDV and VIG.
What is the difference between DVY and SPYD?
DVY charges 0.38% and held $23.68B on Nov 10, 2026; it tracks the Dow Jones U.S. Select Dividend Index and holds 98 stocks. SPYD charges 0.07% and held $7.79B; it tracks the S&P 500 High Dividend Index and holds 77 stocks, with real estate as its largest sector.
Which high-yield dividend ETF has the lowest cost?
VYM and VIG list the lowest expense ratio at 0.04%, followed by SCHD at 0.06%, SPYD at 0.07%, HDV at 0.08% and DVY at 0.38%. On $100,000 that is $40 a year for VYM against $380 for DVY.
Which of these funds pays the highest yield?
On the issuer pages SPYD showed a trailing yield of 4.12% and DVY 3.51%, the highest of the six, while VIG showed about 1.49%. The yields are dated differently, so compare them with the NAV return.
How are SCHD and VYM different from DVY and SPYD?
SCHD screens for dividend quality and VYM holds a broad set of above-average yielders at a very low fee, while DVY and SPYD concentrate on the highest-yielding stocks and end up more heavily weighted to a few sectors.
Is a high yield the same as a high return?
No. A high yield can come from a falling share price, and the yield says nothing about the change in price. Compare the yield with the NAV total return.
Should I own more than one of these ETFs?
Usually not. The funds hold U.S. dividend stocks and many lean on the same sectors, and sector overlap runs up to about 81% in the pairs on this page.
How are dividend ETF distributions taxed?
Distributions can include qualified dividends, ordinary dividends and sometimes return of capital, and the mix changes each year. Each issuer publishes a year-end tax breakdown. Confirm the details with a tax professional.
Do these funds pay monthly or quarterly?
All six pay distributions quarterly according to the issuer pages used here.
Are these ETFs a good fit for Canadian investors?
U.S.-listed funds can work, but you face currency conversion, and withholding tax and tax treatment depend on the account. Confirm the details with a qualified tax professional.
Educational research, not personalized investment, tax or legal advice, and not a recommendation to buy or sell any fund. Investing involves risk, including loss of principal. Past performance does not guarantee future results. Fund data are provided as published by the sources named and may differ from current figures.