Correlation vs Causation in Economics: How to Evaluate an Economic Claim
Understand why two variables can move together without one causing the other, how economists test causal claims, and what evidence is needed before accepting an economic explanation.
Learning objectives
By the end of this topic, you should be able to distinguish correlation from causation; explain why a counterfactual matters; recognize confounding, selection, reverse causation and shared trends; and assess whether a research design provides credible evidence for an economic claim.
1. Correlation describes a relationship
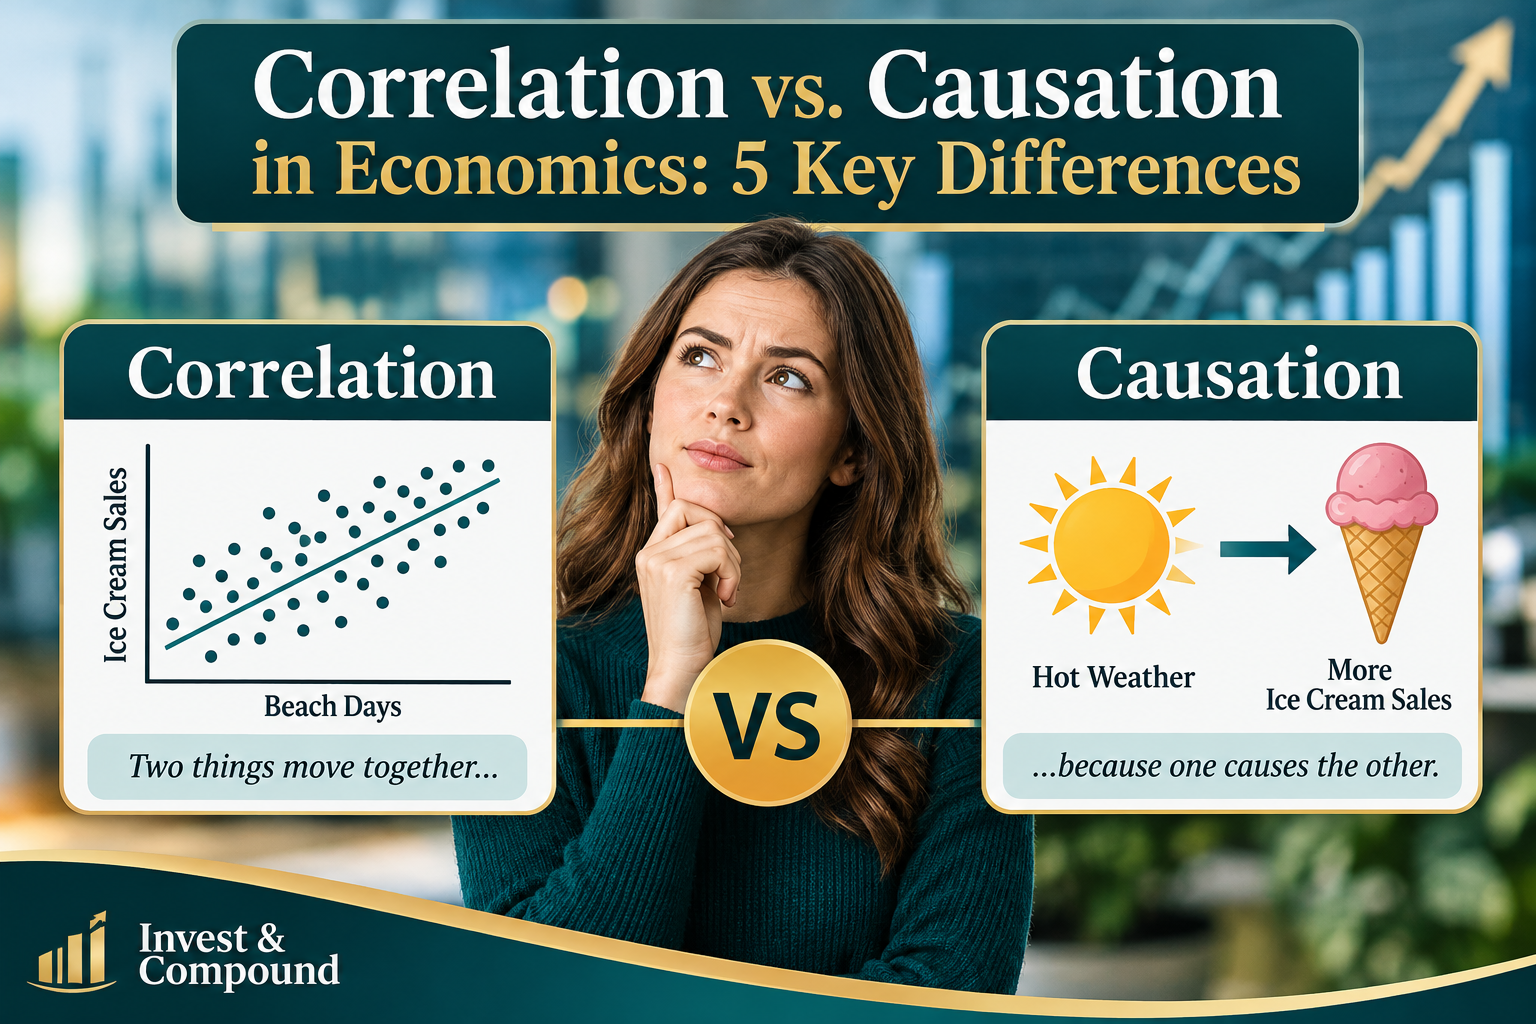
Correlation describes how two variables move together in observed data. A positive correlation means higher values of one tend to accompany higher values of the other. A negative correlation means higher values of one tend to accompany lower values of the other. Little or no correlation means the data do not show a consistent linear pattern.
A correlation is a description, not an explanation. If neighborhoods with more parks also report better health, the pattern alone does not establish that parks caused the health difference. Income, age, access to healthcare, neighborhood design or other factors may contribute.
2. What a causal claim means
A causal claim says that changing one factor would change an outcome, all else relevant held appropriately constant. Economists often ask whether a policy, price, program or incentive made a difference—not merely whether it appeared alongside a difference.
3. The counterfactual: compared with what?
The counterfactual is the outcome that would have occurred without the intervention, for the unit that received it. We cannot observe both states for the same unit at the same moment. Research designs therefore construct a credible comparison to estimate the missing alternative.
Before-and-after comparisons can be misleading because the outcome may have changed anyway. A business’s sales may rise after a campaign because of seasonality, a local event or a broader recovery. The relevant question is not only what happened afterward, but what likely would have happened without the campaign.
4. Confounding variables
A confounder is a factor related to both the explanatory variable and the outcome that can create or distort their observed relationship. For example, education and earnings may be positively associated, but family resources, prior preparation, location and access to opportunities may influence both.
Confounding does not mean the relationship is false. It means the raw comparison does not isolate the causal effect. Researchers must explain which alternative factors matter and how their design addresses them.
5. A hypothetical training-program example
Imagine a fictional employment program called SkillBridge. Participants have higher employment rates afterward than nonparticipants. It would be tempting to conclude that the program caused the difference.
But participants may have been more motivated, had stronger prior work histories, or had better access to transportation. Employers may have selected applicants they already considered likely to succeed. These differences could affect employment even without the program.
| Observed group | Employment rate | What it tells us |
|---|---|---|
| SkillBridge participants | 90% | Outcome among participants |
| Nonparticipants | 40% | Outcome among a different group |
The 50-percentage-point gap is an association. It is not automatically the program’s causal effect. These figures are illustrative, not real program data.
6. Selection and reverse causation
Selection bias occurs when the way people enter a group makes it systematically different from the comparison group. Volunteers, applicants and people who complete a program may differ from those who do not.
Reverse causation occurs when the outcome influences the supposed cause. For example, higher productivity may allow a firm to pay higher wages, while higher wages may also help a firm recruit or retain productive workers. A correlation between wages and productivity alone cannot determine the direction.
7. Shared trends and misleading patterns
Two variables can move together because both respond to time, population growth, inflation, technology or another common force. A rising trend in each series does not establish that one drives the other.
Researchers consider whether the relationship remains after accounting for relevant time patterns, whether it appears in changes rather than just levels, and whether the proposed mechanism makes sense. Statistical adjustment helps only when the assumptions behind it are credible.
8. Correlation coefficients: useful but limited
A correlation coefficient summarizes the direction and strength of a linear association, commonly on a scale from −1 to +1. A value near +1 indicates a strong positive linear relationship; near −1, a strong negative linear relationship; and near 0, little linear association.
It does not reveal the causal direction, rule out confounding, establish practical importance, or capture every nonlinear relationship. A small correlation can matter in some settings, while a large correlation can be entirely noncausal.
9. Research designs that strengthen causal inference
Randomized experiments
When feasible and ethical, randomly assigning eligible units to treatment and comparison groups can balance observed and unobserved characteristics on average. Researchers still need to check implementation, attrition, spillovers and whether the measured outcome matches the question.
Before-and-after with a comparison group
Comparing changes for a treated group with changes for a suitable untreated group can help remove common shocks. The difference-in-differences approach depends on a key assumption: absent treatment, the groups would have followed parallel trends. Researchers examine pre-treatment trends and other threats to that assumption.
Natural experiments and quasi-experiments
Policy rules, eligibility thresholds, geographic boundaries or unexpected events may create variation that resembles an experiment. These designs can be powerful, but the source of variation must be plausibly independent of other determinants of the outcome, and the estimated effect may apply only to a particular group or setting.
Regression and controls
Regression can adjust for measured variables and estimate conditional relationships. It does not automatically make a study causal. Unmeasured confounding, poor measurement, inappropriate controls or a misspecified model can remain.
10. Statistical significance and practical importance
A result can be statistically distinguishable from zero yet economically small. Conversely, an imprecise estimate may still be compatible with effects that matter. Evaluate the estimated magnitude, uncertainty, costs, benefits and decision context—not only a p-value or headline.
11. External validity: will it generalize?
A credible estimate in one setting may not transfer to another. Effects can differ by population, labor market, institutions, implementation quality or time. Ask who was studied, where, when, and whether the mechanism is likely to operate in the new context.
12. Evaluate the claim, not just the number
Consider this headline: “Job training raises employment by 50 percentage points.” Before accepting it, identify the treatment, outcome, population, comparison group, time horizon and research design. Check whether the estimate is an observed gap or a causal effect, and whether uncertainty and limitations are reported.
13. A practical causal-claim checklist
- What exact cause or intervention is being claimed?
- What outcome is measured, and over what period?
- Compared with what credible alternative?
- How were participants or units selected?
- Could confounders or reverse causation explain the pattern?
- Could a common trend or shock affect both variables?
- What research design identifies the effect, and what assumptions does it require?
- How large is the estimate, how uncertain is it, and is it practically meaningful?
- To whom and where might the result generalize?
- Do the conclusions match the evidence—or go beyond it?
14. Practice: separate pattern from explanation
There is no single design that answers every question. The right approach depends on the intervention, available data, ethical constraints and assumptions that can be defended.
15. Prediction is not the same as intervention
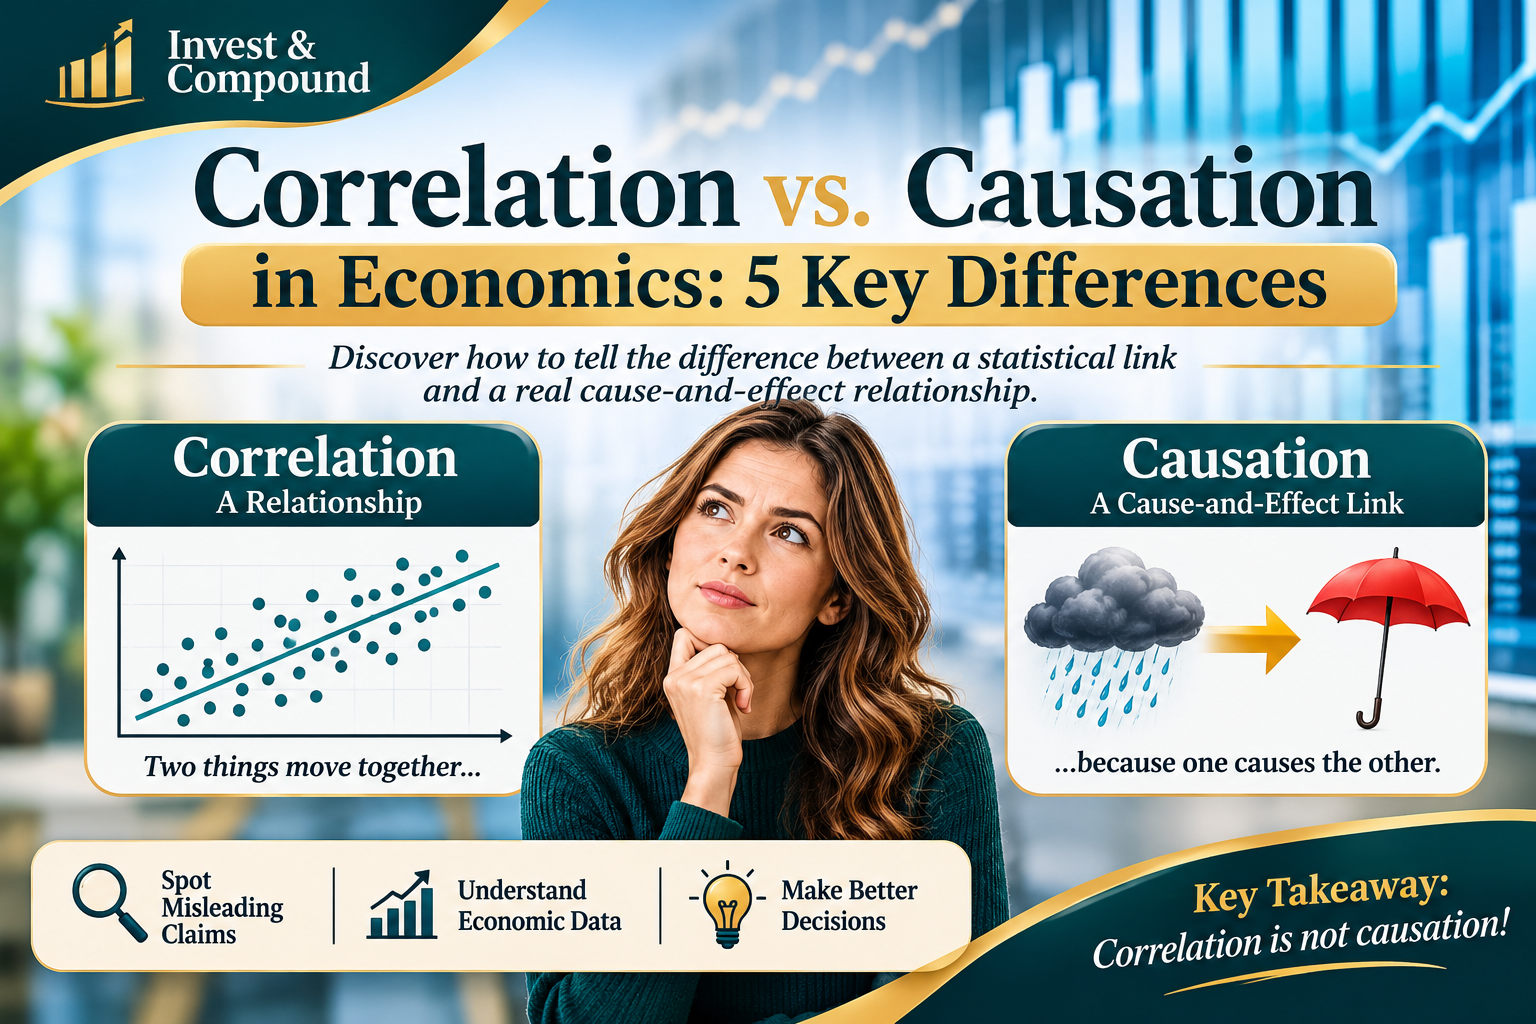
A variable can help predict an outcome without being a useful policy lever. Umbrella sales may predict rainy days, but increasing umbrella sales would not cause rain. Economic analysis distinguishes forecasting relationships from claims about what would happen if a decision-maker changed a variable.
16. Read causal language carefully
Words such as “causes,” “leads to,” “raises,” “reduces” and “impact” imply more than “is associated with” or “moves alongside.” Strong causal wording should be supported by a design that identifies a causal effect. When evidence is observational or limited, qualify the conclusion.
17. What controls can—and cannot—do
Adding controls may reduce bias from measured confounders, but indiscriminately controlling for variables can create new problems. A control that lies on the causal pathway may remove part of the effect of interest; conditioning on a common consequence can introduce bias. The choice of controls should follow a clear causal question, not a search for a preferred result.
18. Attrition, compliance and spillovers
Participants who leave a study may differ from those who remain. People assigned to a program may not participate, while people in the comparison group may access similar services. Treatment can also affect others—for example, a training program may change competition for jobs. These issues can alter what an estimate means.
19. Difference-in-differences in a simple example
Suppose employment rises from 60% to 70% in a treated region and from 58% to 63% in a comparison region. The treated region changes by 10 percentage points; the comparison changes by 5. The difference-in-differences estimate is 5 percentage points.
This calculation is not proof by itself. Its causal interpretation depends on the parallel-trends assumption and the absence of other differential changes that coincide with treatment.
20. Economic significance depends on the decision
Interpret an effect relative to its baseline, costs, distribution and alternatives. A small average effect may be important for a large population or low-cost intervention. A large average effect may conceal unequal outcomes or high implementation costs. Causal evidence informs decisions; it does not replace judgment about objectives and trade-offs.
21. Avoid overclaiming from one study
One study may be informative without settling a question. Compare results across credible designs, populations and time periods. Look for transparent methods, replication, plausible mechanisms and honest discussion of limitations. Disagreement among studies can reveal that effects depend on context.
22. A disciplined reading routine
When you encounter an economic claim, write down the causal question in one sentence. Identify the comparison, draw a simple diagram of possible causes, inspect the research design, assess uncertainty, and state the conclusion at the strength the evidence supports. Keep “what we observe” separate from “what we infer.”
23. Key takeaway
Key takeaway: Correlation is evidence of a pattern, not a verdict about cause. Causal reasoning requires a credible counterfactual, attention to alternative explanations, and a research design whose assumptions fit the question. The most responsible conclusion is neither automatically skeptical nor automatically confident—it is calibrated to the evidence.
Causal Claim Explorer: Adjust for a Confounding Difference
Explore how a difference between two groups can shrink or disappear when the groups differ in a factor that also affects the outcome. This simplified teaching model is hypothetical; it is not a statistical estimator and does not prove causation.
Model: adjusted difference = observed group difference − (difference in the share with the confounding characteristic × outcome advantage associated with that characteristic).
Previous: Ceteris Paribus Explained: What “Other Things Equal” Means in Economics
References & Further Reading
- World Bank & Inter-American Development Bank. Impact Evaluation in Practice (2nd ed.). World Bank.
- OpenStax. Introductory Business Statistics 2e. OpenStax.
SkillBridge, all employment rates, regional figures and scenarios in this topic are fictional teaching examples. They are not measured results or forecasts.
Educational disclosure: This article provides general economics education and does not constitute personalized investment, tax or legal advice. All numerical examples and calculator outputs are hypothetical illustrations.
Correlation alone does not establish causation. Conclusions depend on research design, assumptions, data quality and context. Illustrative calculations do not predict real-world outcomes.