Economic Models Explained. Why Economists Simplify Reality
Understand economic models, their assumptions and limitations through an original equipment-rental example, worked calculations and interactive tools.
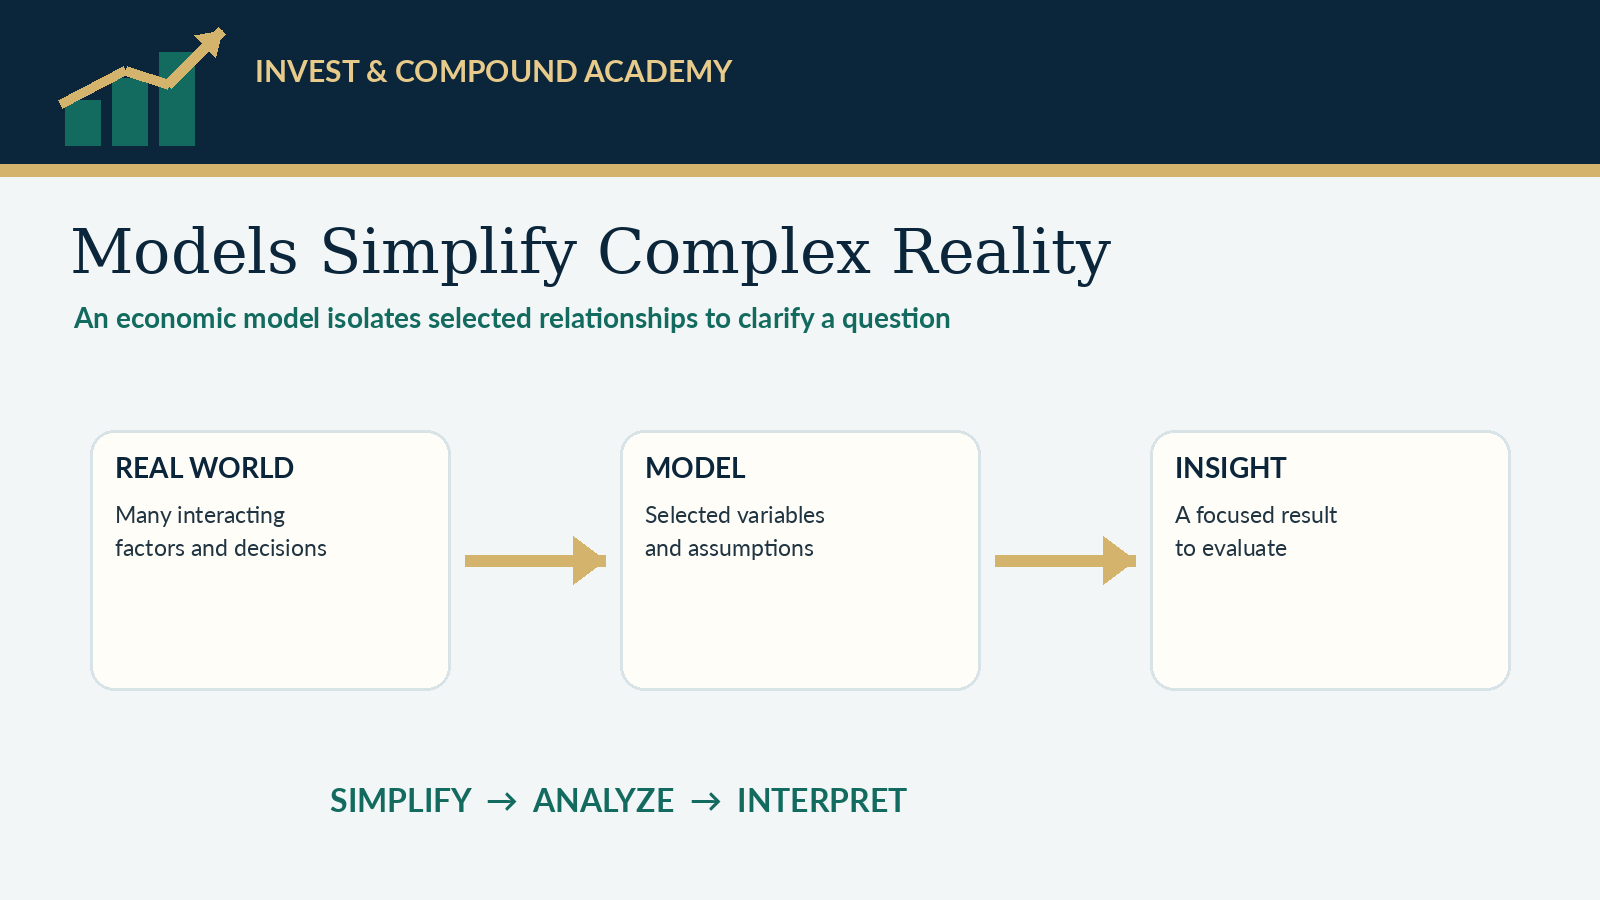
An economic model is a deliberately simplified framework for studying a question about choices, interactions or outcomes. It selects the relationships relevant to that question and represents them through words, diagrams, equations or computer instructions. A useful model helps explain a mechanism, compare alternatives or investigate evidence. It does not need to reproduce every detail of the world. [1]
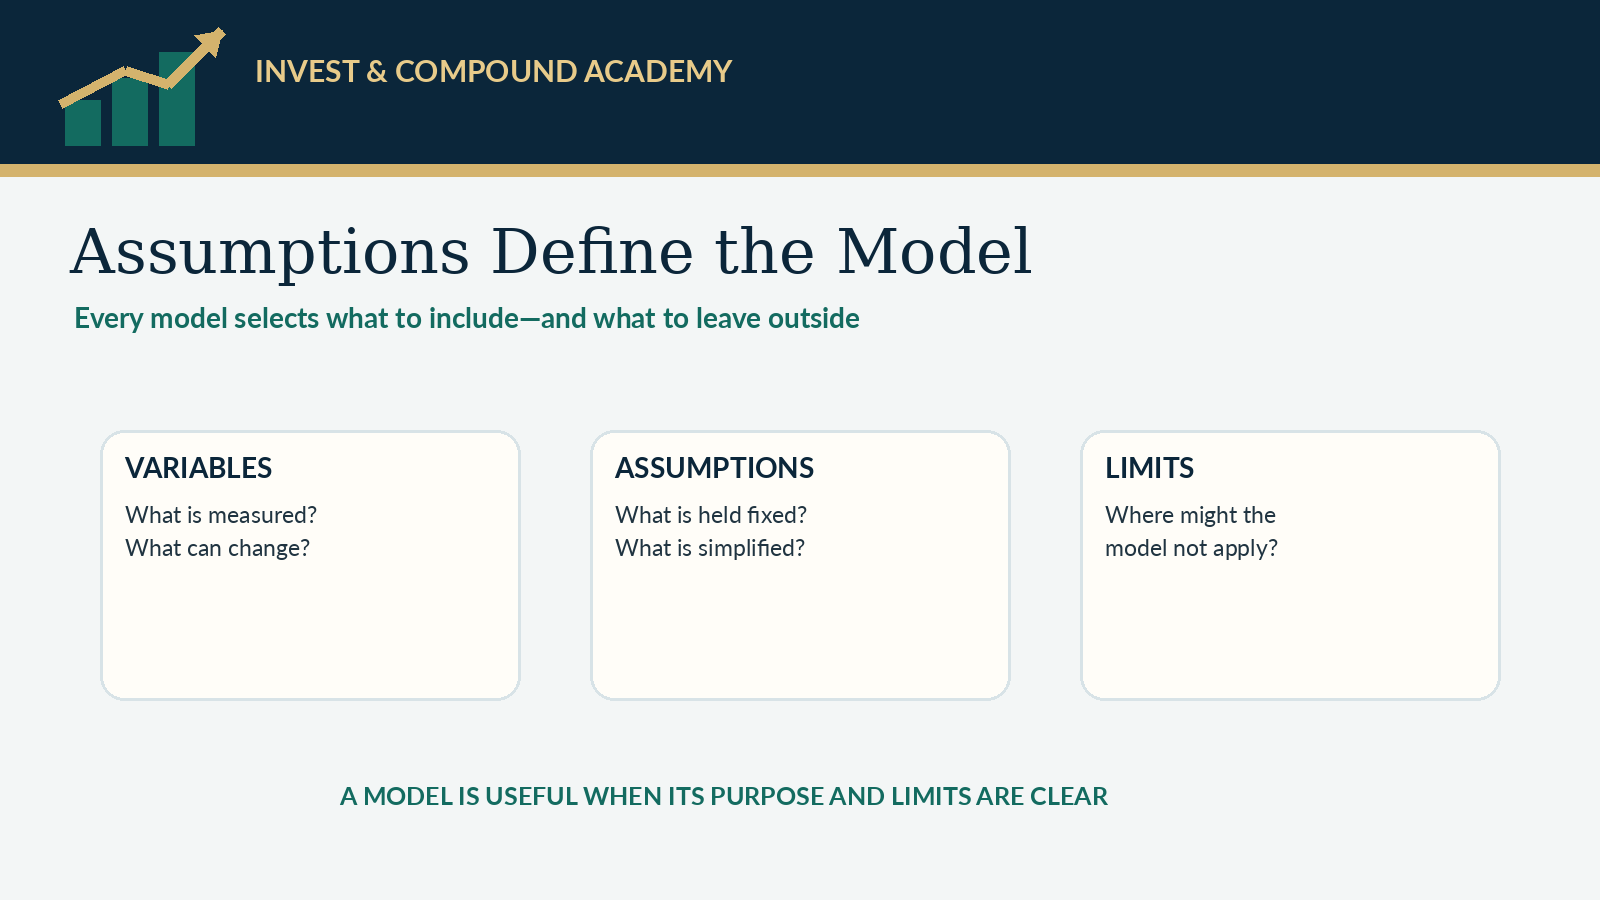
The difficult part is deciding what to simplify. A model that ignores an irrelevant detail becomes easier to use. A model that ignores the mechanism driving the outcome can become misleading. Understanding economic models therefore means learning to inspect their purpose, assumptions and limits, rather than treating an equation as proof of scientific authority.
This topic builds and challenges an original model of a fictional equipment-rental business, Fieldwork Rentals. The company hires out garden tools by the day. The example lets us move from a verbal explanation to a simple equation, test a decision, and identify conditions under which the conclusion changes. Every number is hypothetical and chosen for teaching, not estimated from an actual business.
Topic objectives
After this topic, you should be able to describe what a model is for, identify its variables and parameters, distinguish an accounting identity from a behavioral relationship, and interpret a conditional prediction. You should be able to check whether a model fits its intended task and explain why several models can be useful for different questions.
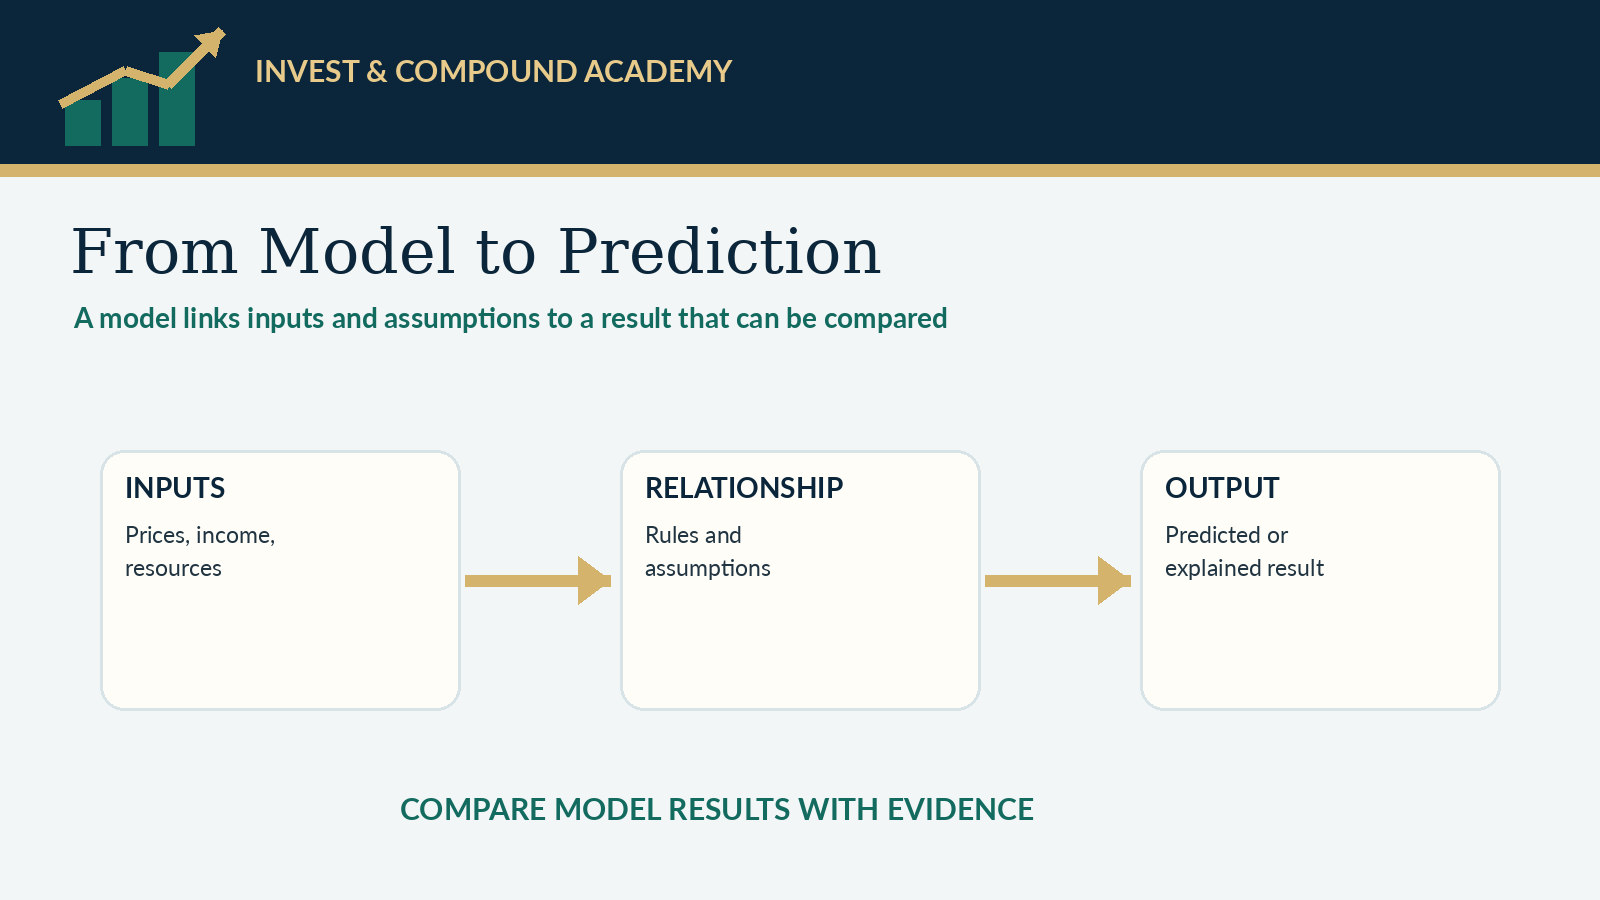
Basic multiplication and division are sufficient. Where an equation appears, the surrounding explanation gives its meaning. The topic does not assume that you can estimate a statistical model or solve an optimization problem. Those skills arrive later, after the underlying reasoning is familiar.
1. A model begins with a purpose
Fieldwork Rentals wants to decide whether opening for an additional Sunday is worthwhile. That is the initial question. A model for this decision needs relevant revenue, additional costs and operating constraints. It does not immediately need a complete theory of national growth, household saving or global energy markets.
Narrowing the question does not deny that the wider economy matters. It establishes a manageable starting point. If fuel costs, financing or local employment materially affect Sunday demand, the model may need to include them. Their relevance should be explained through a mechanism rather than assumed merely because they exist.
Write the purpose before choosing equations. “Estimate the additional operating contribution from one Sunday under specified demand and cost assumptions” is clear. “Model the business” is too broad. A precise purpose helps determine which output is useful, which inputs are required and how to judge whether the simplification is appropriate.
2. The model boundary determines what is included
A model boundary identifies the activities, people, period and outcomes covered. For Fieldwork Rentals, we initially consider one additional day, one standardized rental product and the company's operating contribution. We exclude long-term expansion and other product lines to keep the first calculation interpretable.
That boundary creates limitations. Opening on Sunday could shift rentals away from Saturday rather than create entirely new business. It might require additional maintenance later. It could affect staff schedules or customer loyalty. If those effects are material, a one-day model that ignores them will overstate or understate the benefit.
Boundaries should therefore be stated rather than hidden. A result called “Sunday operating contribution before displaced weekday sales” is more honest than “total profit from opening.” Precision about scope prevents a narrow calculation from being stretched into a complete judgment about the business or the community.
3. Start with a verbal mechanism
Before writing algebra, describe what changes. Opening an additional day may bring additional rentals. Each rental generates revenue and requires some incremental resources. The business also incurs costs associated with opening regardless of the number of rentals, such as a minimum staffing arrangement.
That verbal description suggests the structure of a model. Additional operating contribution equals revenue from additional activity minus the costs caused by that activity. To make the calculation meaningful, identify whether each cost changes with the decision. Existing costs that remain unchanged should not be treated as avoidable savings if the day is canceled.
The verbal explanation also reveals assumptions. We have implied that the rental product is comparable across customers, that extra activity can be accommodated and that per-rental costs are reasonably stable. These assumptions may be suitable for a small pilot. They become less credible if demand requires more equipment, different insurance coverage or additional staff.
4. Variables, parameters and decisions play different roles
A variable can take different values within the model. Rental quantity is one example. A parameter is treated as fixed for a particular calculation, such as the assumed cleaning cost per rental. A decision variable is something the decision maker chooses, such as the posted rental price, within whatever constraints apply.
These roles depend on the question. If the business wants to compare several prices, price becomes a decision variable. If the price is fixed by an existing promotion, it may be treated as a parameter. In a wider model, a cost previously held fixed could become an outcome influenced by other markets.
Distinguishing the roles makes the model easier to inspect. Ask what the business controls, what it takes as given and what the model predicts. A spreadsheet can accidentally blur these categories by allowing every cell to change without explaining why. A coherent model gives each important input and output a defined role.
5. Build the initial contribution model
Assume the rental price is $30 per unit-day and the incremental cost of cleaning, wear and transaction processing is $8 per rental. Opening the additional day costs $220 in staffing and setup. Let Q represent additional rentals, under the assumption that none displace rentals from another day.
The contribution per rental is $30 minus $8, or $22. The day's incremental operating contribution is therefore $22 times Q, minus $220. At 15 rentals, contribution is $330 minus $220, or $110. At 8 rentals, it is $176 minus $220, or negative $44.
The formula is useful because it shows how quantity affects the result under the stated assumptions. It is not an empirical claim that 15 rentals will occur. Quantity must come from a forecast, a scenario or observed pilot data. A correct equation does not guarantee accurate inputs.
6. Break-even is a threshold, not a forecast
With a positive $22 contribution per rental and $220 in opening costs, break-even quantity is 10 rentals. At that quantity the simplified incremental contribution is zero. Below it, the model shows a loss for the additional day; above it, a positive contribution.
If the ratio were 10.4 rentals, a business counting whole completed rentals would need 11 to cover costs under these assumptions. Rounding is part of interpretation. Fractional outputs can be meaningful in some settings, but customers do not necessarily arrive in divisible units.
A threshold helps frame the evidence question: how plausible are at least 10 additional rentals, and how uncertain is that estimate? It does not tell the owner whether demand will exceed the threshold. Treating break-even as a sales forecast reverses the model's logic. The business needs independent information about demand and the reliability of the cost assumptions.
7. An accounting identity is different from a behavioral equation
Revenue equals price multiplied by quantity in this simplified single-product setting. Once price and completed quantity are defined consistently, this is an accounting relationship. It does not explain why customers chose that quantity or why the business selected that price.
A demand equation attempts to describe behavior: how quantity might respond to price and other conditions. Suppose we introduce the hypothetical relationship Q equals 40 minus 0.8 times P, where P is the price in dollars. At $30, the equation gives 16 rentals. The coefficients are teaching assumptions, not estimates.
Combining the two relationships creates a richer model, but it also introduces a stronger claim. We now rely on a proposed behavioral response. The arithmetic can be flawless while the demand equation is inappropriate. That distinction is fundamental: identities ensure consistency, while behavioral relationships require theoretical justification and, for applied use, empirical support.
8. Units provide a basic error check
In the demand equation, the intercept 40 represents rentals per Sunday when price is zero under the hypothetical relationship. The coefficient 0.8 represents the change in rental units associated with a one-dollar price change. Its units differ from the intercept's units.
In the contribution equation, dollars per rental multiplied by rentals produces dollars. Subtracting a dollar cost then makes sense. Subtracting an hourly wage directly from daily revenue would not be consistent unless the relevant hours were incorporated. Unit errors can survive inside complicated spreadsheets when labels are missing.
Label every input with both its quantity and its period. Is the price per hour, per day or per week? Is staffing cost per employee or for the entire opening? Does quantity refer to bookings, completed rentals or rental-days? A model can produce precise numbers that are meaningless if its units do not align.
9. A linear relationship has a domain
The assumed demand equation gives fewer rentals at higher prices. At $50 it reaches zero. Beyond that, the raw equation becomes negative, which is not a feasible number of rentals. One teaching adjustment is to bound the predicted quantity below at zero, while recognizing that the original linear form has limited applicability.
A linear relationship can be convenient within a narrow range without being sensible everywhere. An intercept at a zero price may have no practical relevance if the business never offers free rentals. Extrapolating far outside the range of credible evidence can generate absurd conclusions even when the equation fits local observations.
The key is to state the domain. Specify the price range, customer group and operating conditions for which a relationship is intended. A model's failure outside that domain does not necessarily invalidate its local use. Applying it outside the domain without warning, however, is an analytical mistake.
10. Add capacity when it matters
Suppose Fieldwork Rentals has only 18 usable tools available on Sunday. A predicted demand of 24 does not create additional equipment. Completed rentals are constrained by capacity, assuming each tool can serve only one relevant rental during the modeled period.
One simplified representation is completed quantity equals the smaller of predicted demand and capacity. At a low price, the business may reach the capacity limit. Lowering price further would then reduce revenue per rental without increasing completed quantity under this model. That conclusion follows from the assumed capacity and operating arrangement.
Real operations may be more flexible. Some tools could return early, equipment might be hired from another supplier, or different products might substitute. A capacity constraint should reflect the actual decision horizon. For a one-day pilot, existing equipment may be fixed. Over several months, the company might expand its fleet, making capacity a decision rather than a fixed parameter.
11. Compare candidate prices without pretending to estimate an optimum
Using the hypothetical demand equation, a price of $25 produces demand of 20 rentals, limited to 18 by capacity. With $8 variable cost and $220 opening cost, operating contribution is 18 times $17 minus $220, or $86. At $30, quantity is 16 and contribution is 16 times $22 minus $220, or $132.
At $35, demand is 12 and contribution is 12 times $27 minus $220, or $104. Among these three scenarios, $30 produces the highest modeled contribution. This is a comparison of selected candidates, not proof that $30 is the best possible real-world price.
An actual pricing decision requires reliable demand information, competitor responses, product differences and operational details. The illustrative model gives readers a controlled environment for understanding the mechanism. It should not be presented as a pricing recommendation for a real business whose conditions have not been investigated.
12. Comparative statics asks what changes between scenarios
Comparative statics compares outcomes under different assumed conditions without necessarily modeling the path between them. For example, we can ask how the selected price scenarios change if opening cost rises from $220 to $260 while everything else remains fixed.
Each scenario's contribution falls by $40, because the fixed cost increases by the same amount. The ranking among the three prices remains unchanged in this particular model. If variable cost rises instead, the effect differs across scenarios because the quantity sold differs. A change that leaves one ranking intact need not leave every ranking intact.
This is a useful way to understand mechanisms. Change one assumption, explain which equation it enters and trace the consequence. Do not interpret the exercise as evidence that all other conditions really remain fixed. The comparison isolates a relationship; an applied forecast may require several conditions to change together.
13. Dynamics asks about the adjustment path
The static Sunday model does not track how customers learn about the service, how equipment wears over time or how competitors respond. A dynamic model would introduce a time sequence and relationships linking today's decisions to later outcomes.
For instance, an initial low price might attract customers who later return, while repeated heavy use could increase maintenance requirements. Equipment purchases affect future capacity, and financing creates future payments. These connections can change the relevant evaluation period and the treatment of costs.
You do not need dynamic programming to recognize a dynamic issue. Ask whether today's action changes tomorrow's opportunities or constraints. If the answer is yes and the effect is material, a one-period model may be insufficient. It can still serve as a first approximation, provided the limitation is stated and longer-term claims are not drawn from it.
14. Partial-equilibrium analysis isolates a market
The rental model holds many surrounding conditions fixed. It does not explain wages across the town, the price of new equipment or household income. This resembles a partial-equilibrium approach: investigate one market or decision while treating relevant external conditions as given.
That approach can be useful when the activity is too small to materially change surrounding markets over the chosen period. It becomes less credible when an intervention is large enough to alter wages, supplier prices or spending across many sectors. The analytical boundary must be reconsidered when feedbacks become important.
A more connected model can represent those feedbacks, but it requires additional relationships and evidence. Bigger is not automatically better. The goal is enough structure to answer the question credibly. An unnecessarily broad model can obscure the key mechanism just as an excessively narrow model can omit it.
15. Calibration and estimation are not interchangeable
A model can assign parameter values using external information or judgment for an illustrative or calibrated exercise. Estimation uses data and a specified statistical procedure to infer parameters. The distinction matters because assumed coefficients should not be described as measured findings.
Our demand coefficients were chosen for teaching. They make the arithmetic easy and allow capacity to matter at one candidate price. They do not reveal how actual rental customers respond. A real estimate would require suitable price and quantity data, an identification strategy and an assessment of uncertainty.
Even a statistically estimated relationship may not answer the intended causal question. Prices can change in response to demand, creating reverse causation. Different days may differ in weather or customer composition. A regression line alone does not solve those issues. later econometrics topics develop the methods; here, the key is to label the origin and interpretation of every important input.
16. Validation should match the model's purpose
A model designed to forecast demand can be compared with demand observed outside the data used to develop it. A model designed to explain a mechanism needs scrutiny of that mechanism and its assumptions. A model used for a policy decision may need both credible causal relationships and careful treatment of implementation.
For Fieldwork Rentals, a pilot could compare predicted and completed rentals, record capacity constraints and investigate whether Sunday bookings displaced other days. If the model repeatedly predicts too many rentals, the owner should examine the demand relationship and operating conditions rather than simply adjust the final number arbitrarily.
Good performance on one task does not prove universal validity. A model might forecast the normal season reasonably well but perform poorly during unusual weather. It may explain average demand while missing important customer groups. Validation should state where the model was tested and what remains outside the evidence.
17. Sensitivity analysis reveals what drives the answer
Suppose the expected Sunday contribution is positive only when opening costs stay below $240. If realistic staffing arrangements could cost $300, the favorable conclusion is fragile. Sensitivity analysis makes that dependence visible by varying plausible inputs and tracking the result.
Changing one input at a time helps identify influential assumptions. Testing combinations can reveal interactions. Lower demand and higher maintenance cost together may produce a loss even if either change alone is manageable. The scenarios should reflect plausible conditions rather than a mechanically chosen percentage range with no justification.
Sensitivity analysis does not automatically assign probabilities. A table showing five outcomes does not establish that they are equally likely. To calculate expected outcomes, you need justified probabilities or a suitable statistical model. Otherwise, present the results as conditional scenarios and explain which evidence would help assess their plausibility.
18. A model can omit a variable for a good or bad reason
Omitting the color of the rental office's walls may be harmless for the Sunday contribution question. Omitting a requirement for an additional employee above a certain booking level may materially distort costs. The difference is whether the omitted feature changes a relevant mechanism or conclusion.
Assumptions should be challenged selectively. Listing every missing detail can make useful analysis impossible. Instead, ask which omissions are likely to matter given the decision's scale, horizon and uncertainty. A feature may be irrelevant for one question and essential for another.
This judgment improves with subject knowledge and evidence. Staff may know that cleaning costs increase sharply after wet-weather use. Customers may reveal that convenience matters more than small price differences. A model should incorporate such information when it changes the task, while distinguishing documented patterns from plausible but untested claims.
19. More complexity can introduce new errors
Adding product categories, customer types and time periods may improve realism, but it also creates more parameters, data requirements and opportunities for mistakes. A complicated model can become difficult to explain, reproduce or validate. Precision of presentation should not be confused with reliability.
A useful development strategy starts with a transparent baseline and adds features when they address a specific weakness. Record what changed and whether the added structure alters the conclusion. If a complex extension produces a very different answer, investigate which mechanism causes the difference.
This process creates an audit trail. Readers can understand whether the new result comes from better evidence, a different objective or an additional assumption. An unexplained black box makes that evaluation difficult. Professional modeling requires communication of the mechanism, not merely an impressive interface or a long list of equations.
20. Models can disagree without one being useless
A simple contribution model might favor opening Sunday, while a model including displaced weekday sales and employee retention costs might advise against it. The disagreement can arise from different boundaries rather than arithmetic errors. Determine what each model measures before comparing conclusions.
Two models can also use different behavioral assumptions. One may assume competitors keep prices fixed; another allows them to respond. Which is more suitable depends on the setting and horizon. Neither assumption should be accepted automatically because it produces a preferred result.
When models disagree, compare the question, inputs, mechanisms and evidence systematically. Identify which differences drive the recommendation and whether available data can help choose between them. Sometimes the honest conclusion is that the decision remains sensitive to unresolved uncertainty. That is more informative than averaging incompatible outputs without understanding their meaning.
21. Models do not select society's objectives by themselves
A contribution-maximizing price is not automatically the most desirable price under every objective. The business might prioritize access, long-term relationships or a social mission. A municipality evaluating a rental library may care about participation and inclusion rather than operating contribution alone.
The objective must therefore be stated before optimization. A model can show the consequences of pursuing a target subject to constraints. It cannot prove that the target is ethically complete simply because the calculation is consistent. This connects directly with the previous topic on positive and normative reasoning.
For transparent reporting, separate the modeled outcome from the recommendation. “This candidate price generates the highest contribution among the three scenarios” is a conditional finding. “The company should choose it” adds a decision criterion and requires consideration of omitted consequences. Keeping that distinction visible makes the analysis more useful, not less decisive.
22. Practice reviewing a model claim
A consultant says that lowering the price to $20 will maximize sales and therefore maximize profit. Under our hypothetical demand relationship, demand would be 24 rentals, but capacity limits completed rentals to 18. Contribution becomes 18 times $12 minus $220, or negative $4. Greater demand does not guarantee a better financial result.
The consultant has confused objectives and ignored a constraint. Even without capacity, profit depends on margin as well as volume. The correct critique identifies those mechanisms rather than simply calling the recommendation unrealistic. It should also acknowledge that our own result depends on assumed demand and cost relationships.
Now suppose the consultant claims the model proves Sunday opening benefits the entire town. That exceeds the boundary. The model considers one business's operating contribution, not community welfare, competitor displacement, environmental effects or distribution. A broader claim requires a broader evaluation with justified additional relationships.
23. A practical model-reading checklist
First, identify the exact question, the outcome and the period. Then ask which decisions are represented and which conditions are held fixed. Check the units, data sources and origin of parameter values. Distinguish identities from behavioral assumptions and forecasts from scenarios.
Next, inspect constraints and feedbacks. Is capacity represented? Can participants adjust? Does the model include consequences outside the immediate transaction? Examine the evidence supporting the relationships and whether the model has been tested for the intended use. Ask how sensitive the conclusion is to plausible changes.
Finally, separate the numerical result from any recommendation. State what the model establishes under its assumptions and what requires further judgment. This method works for household spreadsheets, business cases and public-policy models. The mathematics may become more advanced, but clarity about purpose, mechanism and evidence remains essential.
24. Document revisions so the reasoning remains reproducible
Suppose a Sunday pilot reveals that five bookings were cancellations and three completed rentals replaced bookings that would otherwise have occurred on Saturday. Updating the model requires more than entering the booking count as additional quantity. The measured outcome must match the variable: genuinely additional completed rentals, under the chosen boundary.
Record the original assumption, the new evidence and the reason for the revision. If cleaning costs also change, update that parameter separately so its contribution to the result remains visible. Keep the prior version for comparison rather than silently replacing it and presenting the revised answer as if it had always been known.
This habit supports learning. A forecast error can reveal an omitted mechanism or an unreliable measurement, while a successful prediction may still occur for the wrong reasons. Reproducibility allows another reader to check both possibilities. The professional standard is a defensible process that improves with evidence, not an appearance of never having needed revision.
Continue Learning with Invest & Compound Academy
Explore the complete Economic Thinking chapter, return to its pillar guide, and continue through the topics in this topic sequence.
All topics in this chapter
Use the Fieldwork Rentals example as a practice case: change one assumption, explain the mechanism and state the limit of the resulting conclusion. Planned article links remain provisional until their destination pages are published.
Explore the Earlier Market-Risk and Economic Pillars
References & Further Reading
- OpenStax — Principles of Economics
- International Monetary Fund — Micro and Macro
- OpenStax — Economic Theories and Models
- CORE Econ — The Economy 2.0
These sources introduce foundational economic reasoning, the distinction between microeconomic and macroeconomic analysis, and the role of theories and models in explaining economic issues.
Fieldwork Rentals, its assumed demand relationship, all numerical comparisons and the model-review exercises are original hypothetical teaching material. The coefficients are not estimates or calibrated empirical values.
Educational disclosure: This article provides general economics education and does not constitute personalized financial, business, legal or tax advice. Fieldwork Rentals is fictional, and all model coefficients, numerical assumptions, comparisons and calculator outputs are hypothetical illustrations. They are not empirical estimates, forecasts or recommendations for an actual business. Real-world decisions require relevant evidence, appropriate validation and consideration of local conditions and individual circumstances.