Inflation and Investing: How Rising Prices Affect Your Money
Understand what inflation measures, calculate real returns, compare asset exposures and translate today’s retirement spending into future nominal dollars.
Inflation and investing meet at a practical question: what will your money buy? A larger account balance can represent less economic progress than it appears to if prices have risen faster than the investment.
Imagine $100,000 growing to $125,000 while the relevant price level rises 30%. The nominal gain is 25%, but $125,000 ÷ 1.30 equals approximately $96,154 in starting-date purchasing power. More dollars did not produce more buying power.
This guide explains inflation measures, nominal versus real returns, asset exposures and retirement spending. It uses U.S. CPI, PCE and Treasury securities for the institutional examples; investors elsewhere should use appropriate local indexes, tax rules and product terms. The objective is to understand inflation and investing through economic mechanisms rather than search for an asset that works perfectly in every environment.
What Is Inflation?
Inflation is an increase in the general price level of goods and services over time. It is usually reported as the percentage change in a selected price index over a specified period. A rise in one product’s price is not, by itself, evidence that all prices increased at that rate.
If an index moves from 200 to 210 over one year, measured inflation is 5%. Individual prices can rise faster, rise more slowly or fall. The index combines those changes using its methodology and expenditure weights.
In inflation and investing discussions, always ask which index and period are being used. A monthly change, a twelve-month change and a calendar-year average comparison are different measurements. None describes every household’s spending experience exactly.
Inflation, Disinflation and Deflation
Inflation means the overall price level is rising. Disinflation means a positive inflation rate is slowing. Deflation means the measured price level is falling. Lower inflation does not generally mean a return to earlier prices.
| Observation | Hypothetical price index | Change from preceding observation |
|---|---|---|
| Start | 100.0000 | — |
| After 8% inflation | 108.0000 | +8.00% |
| After another 4% | 112.3200 | +4.00% |
| After another 2% | 114.5664 | +2.00% |
| After 1% deflation | 113.4207 | −1.00% |
Calculations use unrounded values before display. The slowing increases in the middle rows are disinflation; only the final row shows a lower price level. Even then, prices remain above the starting level.
Deflation can increase the purchasing power of a fixed amount of money, but sustained economy-wide deflation can also accompany weaker demand, falling incomes and a heavier real burden of nominal debt. Inflation and investing decisions require that wider context.
How CPI and PCE Measure Inflation
The Consumer Price Index, produced by the U.S. Bureau of Labor Statistics, tracks consumer price changes for its reference population. The Personal Consumption Expenditures price index, produced by the Bureau of Economic Analysis, measures consumption prices within the national accounts framework.
| Feature | CPI | PCE price index |
|---|---|---|
| Producer | Bureau of Labor Statistics | Bureau of Economic Analysis |
| Coverage | Purchases within the relevant consumer population and CPI scope | Broader consumption scope, including some spending on households’ behalf |
| Weights and methods | CPI expenditure weights and index procedures | Different weights and a chain-type Fisher framework |
| Common uses | Consumer price comparisons and many contractual adjustments | Consumption analysis and the Federal Reserve’s inflation objective |
These differences can produce different reported rates without either measure being an error. CPI construction also involves different formulas at different aggregation levels; describing it simply as one permanently fixed basket misses important detail.
Headline versus core inflation
Headline measures include food and energy. Common core measures exclude those categories to help examine underlying trends; they do not imply that households can avoid the expenses. Core inflation is one analytical view, not a complete household budget.
Personal inflation can differ
Rent, transportation, medical needs and other spending weights vary among households. A national index is not a precise measure of each person’s cost of maintaining an unchanged lifestyle. For inflation and investing plans, compare the official measure with the categories most relevant to your goals.
Why Central Banks Watch Inflation
The Federal Reserve’s longer-run goal is 2% inflation measured by the annual change in the PCE price index. That objective concerns the longer run; it does not mean each month’s rate must equal 2%, or that every household will experience it.
A moderate positive goal creates some distance from persistent deflation and the constraints associated with very low nominal interest rates. High or unpredictable inflation makes wages, contracts, borrowing and long-term spending harder to plan. Expectations matter, but supply, demand, productivity and financial conditions also influence outcomes.
Inflation and investing interact with policy through borrowing costs, credit availability and discount rates. Tighter policy can slow spending; easier policy may support activity with a lag. Neither provides an immediate or guaranteed outcome. Our economic recession guide explains the business-cycle channels and why a slowdown differs from a contraction.
What Causes Inflation?
Demand can grow faster than available supply, businesses can face higher input costs, and disruptions can constrain production. These forces often interact. The cause matters because strong demand and an adverse supply shock can produce different consequences for companies and policymakers.
- Demand pressure: spending expands while production capacity cannot respond quickly enough.
- Cost pressure: energy, wages, transport or materials become more expensive; pricing power determines how much firms can pass through.
- Supply disruptions: conflicts, disasters, pandemics or trade barriers reduce availability or raise costs.
- Financial conditions: money, credit, interest rates and expectations affect spending; changes in one monetary aggregate do not mechanically produce an identical immediate change in consumer prices.
- Currency depreciation: imported goods can become more expensive in local currency, with pass-through depending on contracts, import exposure and competition.
A single cause rarely explains an entire episode. Evaluating inflation and investing therefore involves asking both why prices are changing and how businesses, consumers and policy may respond.
Inflation and Investing: The Purchasing-Power Calculation
There are two related questions: what will today’s spending basket cost later, and what will a fixed future balance buy in today’s dollars? The first multiplies by the cumulative price factor; the second divides by it.
A $40,000 annual basket costs approximately $72,244 after twenty years at constant 3% inflation. The calculation is $40,000 × 1.03^20. This is a hypothetical scenario, not a forecast.
| Constant annual inflation | Future cost of today’s $40,000 basket after 20 years |
|---|---|
| 2% | $59,438 |
| 3% | $72,244 |
| 4% | $87,645 |
| 5% | $106,132 |
| 6% | $128,285 |
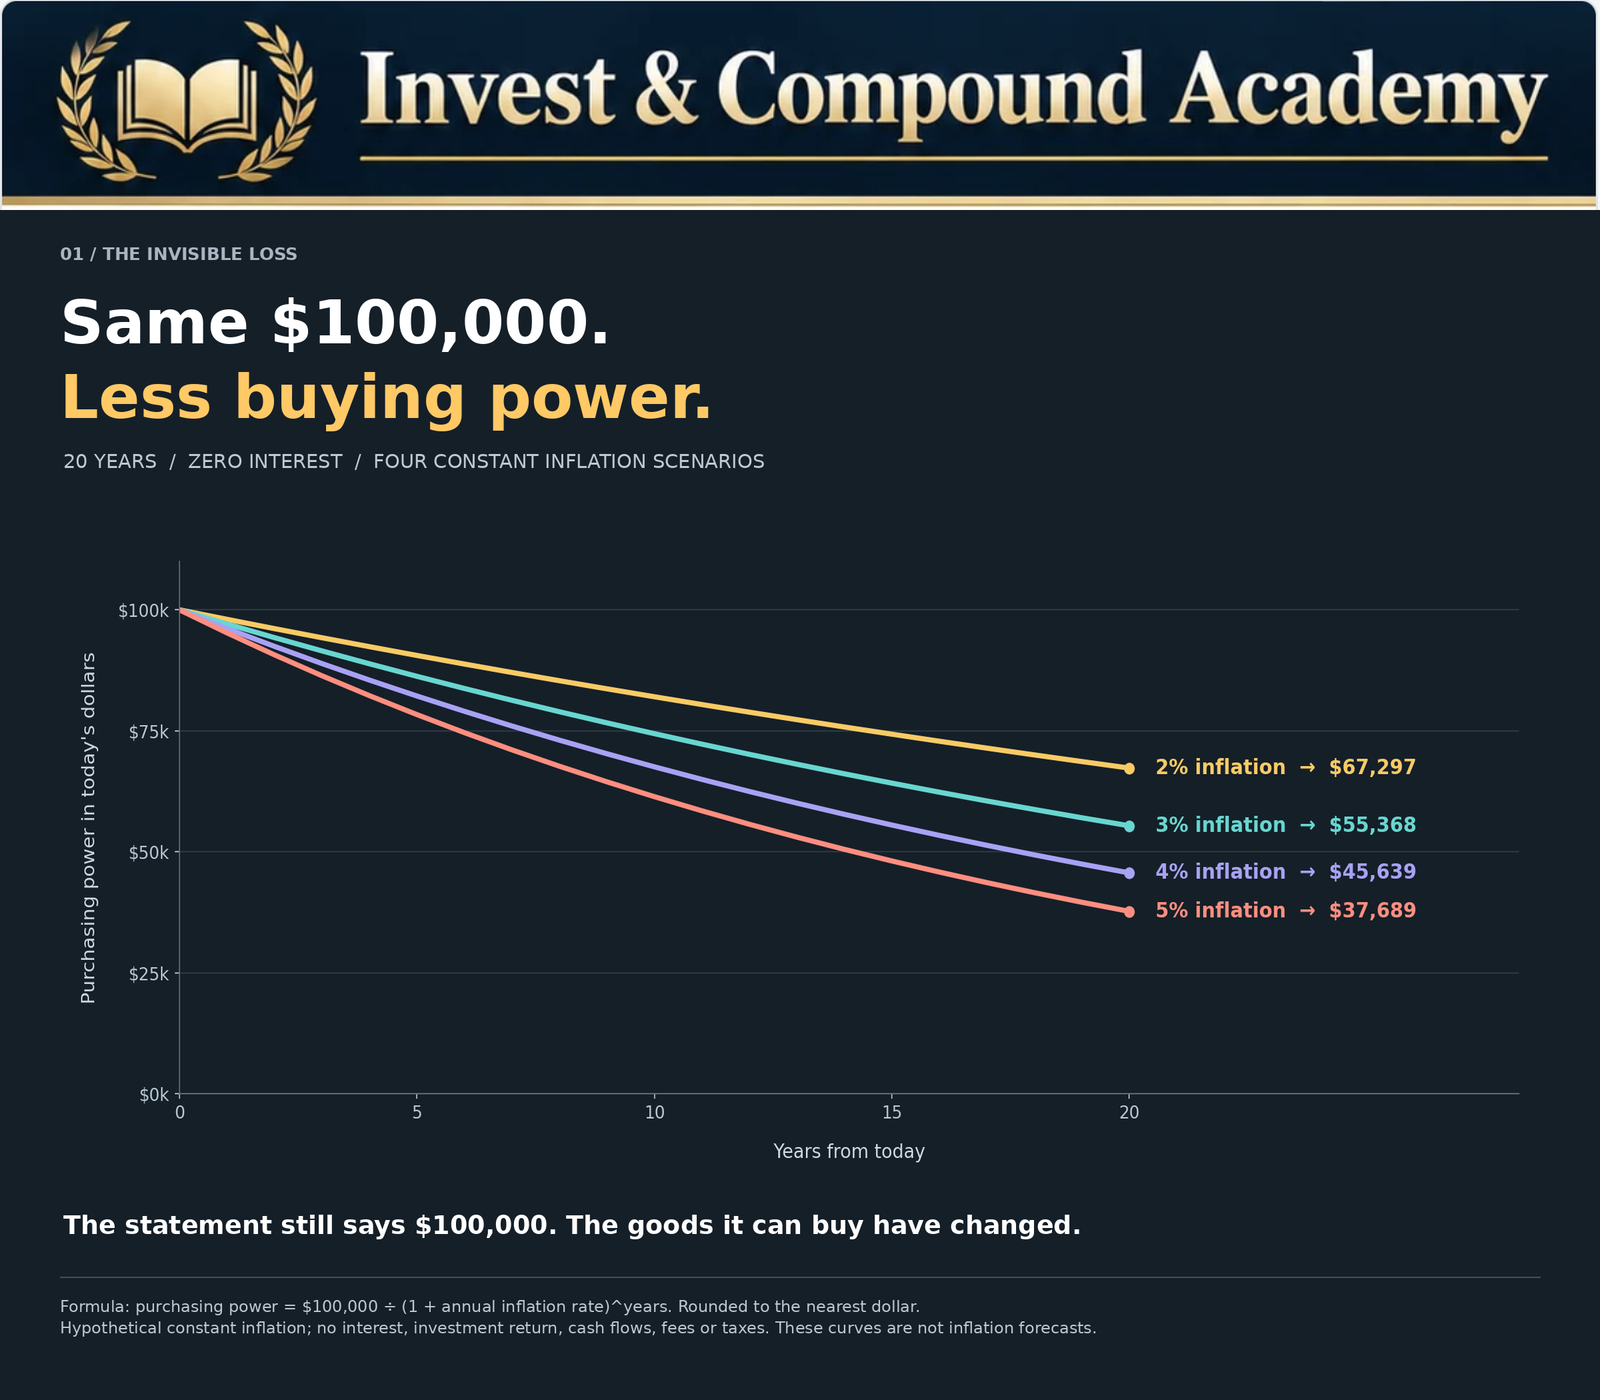
The chart below instead holds the nominal balance at $100,000, with no interest. After twenty years, its purchasing power is approximately $67,297 at 2%, $55,368 at 3%, $45,639 at 4% or $37,689 at 5% annual inflation. The statement balance does not change; its economic meaning does.
These constant-rate examples make inflation and investing assumptions visible. Actual inflation varies, and a household’s personal spending pattern can diverge from the chosen index.
Nominal vs Real Returns
Nominal returns measure performance in currency units. Real returns adjust for the price level over the same period. The exact relationship divides growth factors rather than simply subtracting percentages.
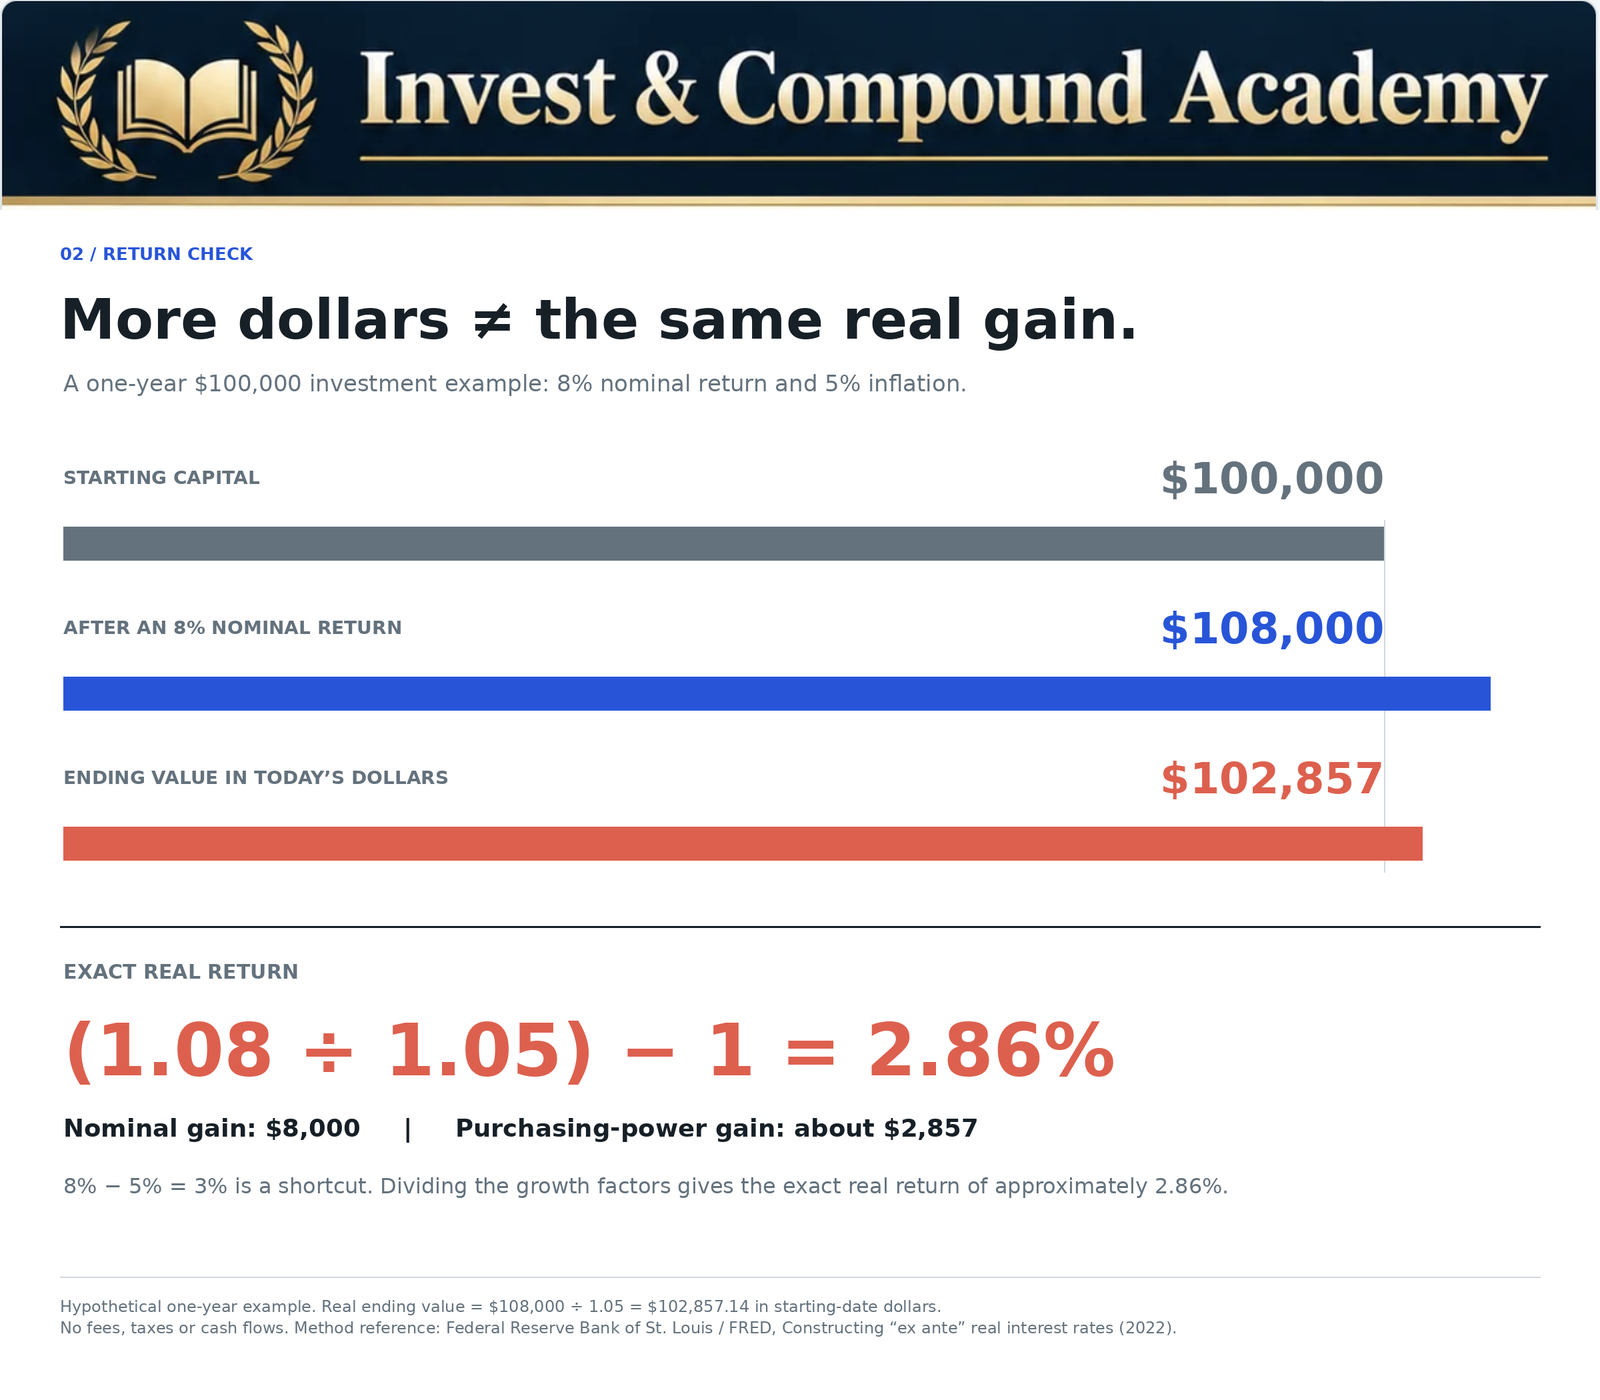
With an 8% nominal return and 5% inflation, the exact calculation is 1.08 ÷ 1.05 − 1 ≈ 2.86%. A $100,000 investment becomes $108,000 nominally, equivalent to approximately $102,857 in starting-date dollars.
Subtracting 5% from 8% gives a 3% approximation. It is close, but the exact real return is smaller. This distinction is central to inflation and investing because repeated differences compound over long periods.
| Nominal return | Inflation over the same period | Real return |
|---|---|---|
| 3% | 2% | 0.98% |
| 5% | 3% | 1.94% |
| 7% | 3% | 3.88% |
| 8% | 5% | 2.86% |
| 6% | 8% | −1.85% |
| 10% | 6% | 3.77% |
A 3% nominal gain with 5% inflation produces approximately −1.90% real return. Conversely, a 2% nominal loss during 4% deflation produces 0.98 ÷ 0.96 − 1 ≈ +2.08% relative to that price index. These are mathematical examples, not claims that deflation is economically desirable.
The figures exclude fees and taxes. Use investment returns, inflation and currency units that cover the same period. A CPI adjustment also measures purchasing power relative to that index, not a perfectly individualized household basket.
Inflation and Compound Investment Growth
Investment growth and the price level both compound. For constant nominal return r and inflation i over n years, the real growth factor is [(1 + r) ÷ (1 + i)]^n. Compounding the arithmetic difference r − i is an approximation.
At 7% nominal growth for twenty years, $10,000 becomes approximately $38,697. With 3% annual inflation, the same ending balance is worth approximately $21,426 in starting-date dollars, calculated from unrounded values. Both amounts describe the same investment in different units.
For varying annual rates, multiply each year’s growth factor and divide by the corresponding cumulative inflation factor. Do not replace a volatile investment path with an arithmetic average and assume an identical outcome. Deposits and withdrawals require additional cash-flow treatment.
For the mechanics, see how compound interest works. Our guide to measuring investment growth separates returns from account deposits and transfers. This article concentrates on inflation and investing rather than repeating those balance-reconciliation methods.
How Inflation Affects Stocks
Businesses can sometimes raise prices as costs rise, but the effect on profitability depends on demand, competition, labor, materials and financing. Higher nominal revenue does not automatically mean higher real profit or a higher share price.
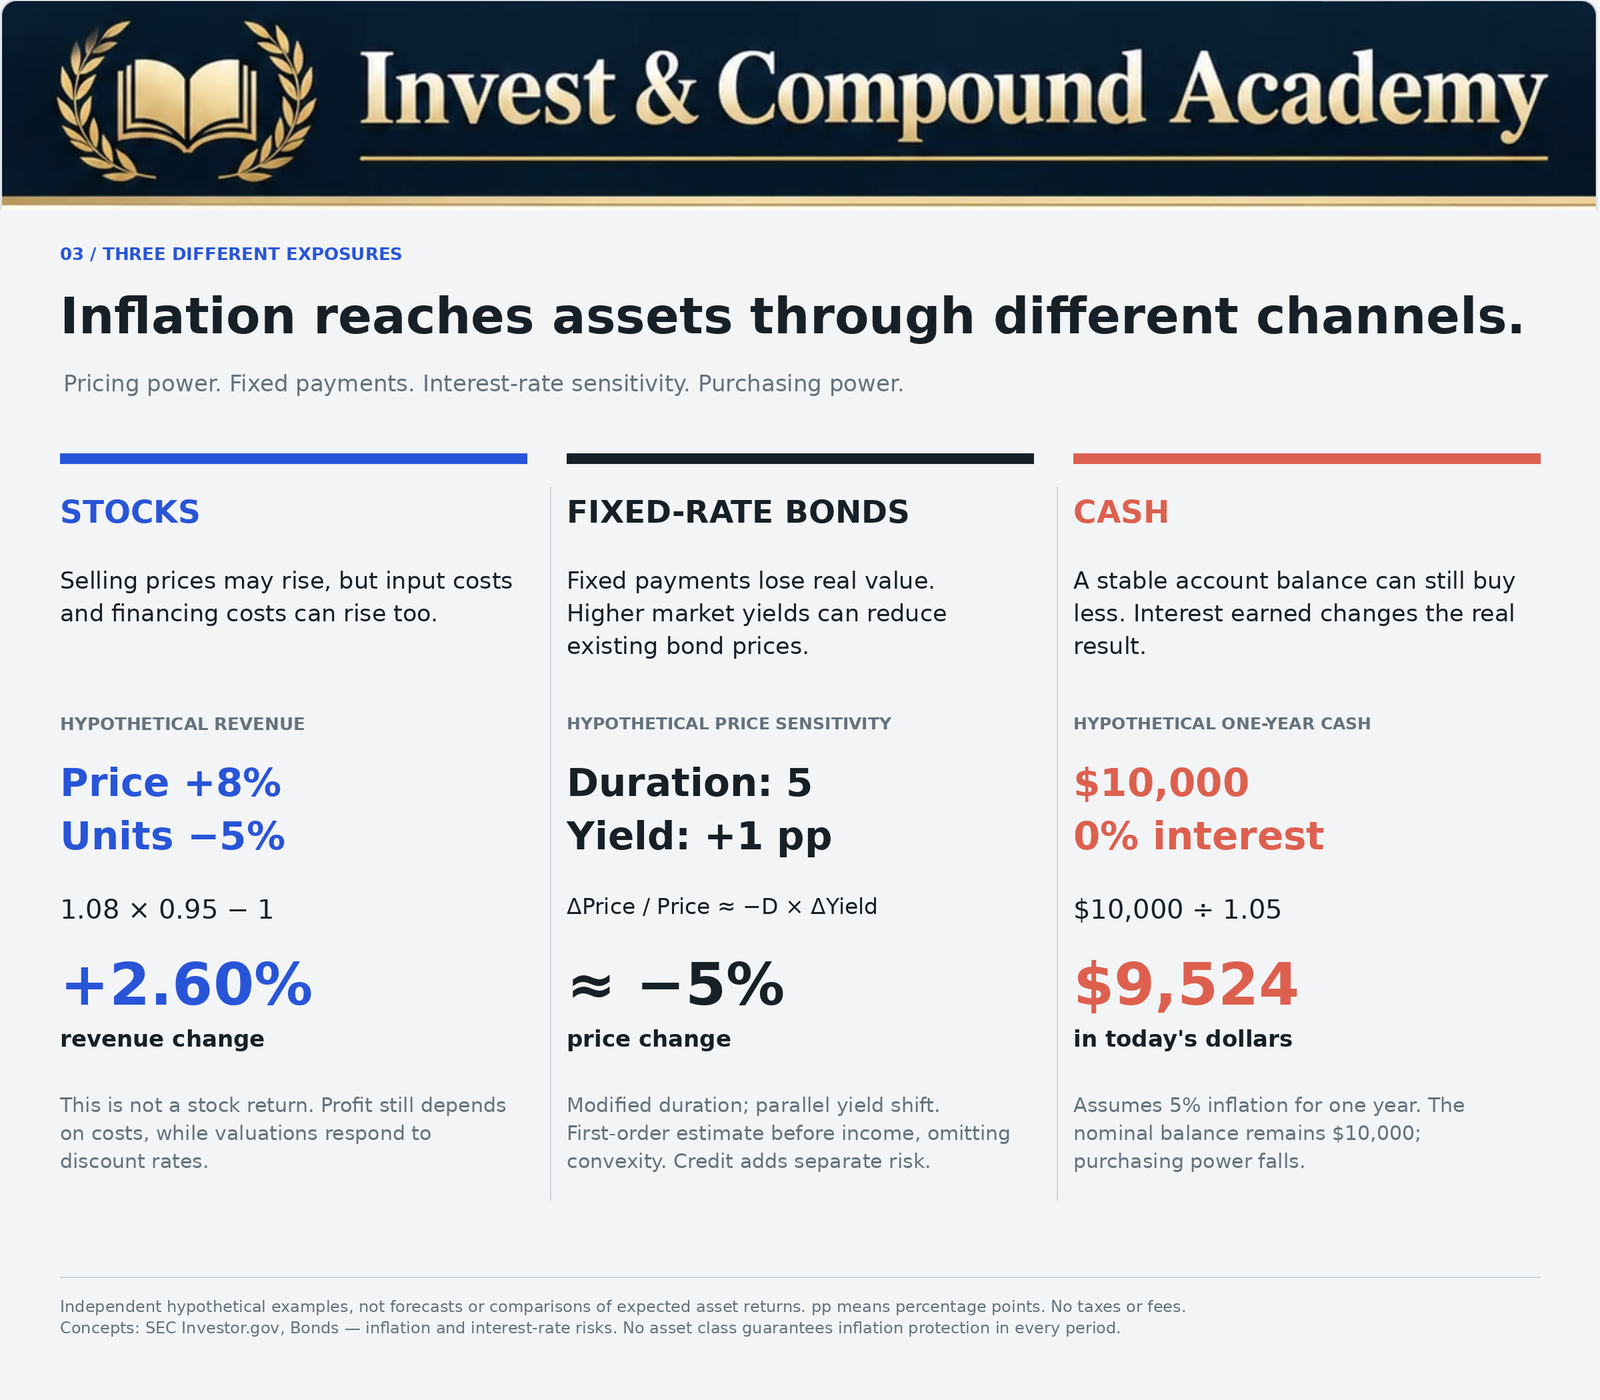
For example, an 8% increase in selling prices combined with a 5% fall in units sold changes revenue by 1.08 × 0.95 − 1 = +2.60%. That is a revenue calculation, not an investment return. Profit still depends on costs.
Pricing power, margins and financing
Strong brands, essential products or differentiated services can support pricing power, but customers and competitors can respond. If expenses outpace revenue, margins compress. Debt structure and refinancing needs determine how higher interest rates affect cash flow.
Inflation and investing also connect through valuation. A stock can fall despite growing earnings if investors demand a higher return or pay a lower multiple. Use our stock research guide, P/E ratio explanation and PEG ratio guide to separate earnings assumptions from the price paid.
Growth and value labels are incomplete
The present value of a hypothetical $100 cash flow in ten years is $61.39 at a 5% discount rate, or $46.32 at 8%. The cash flow is unchanged; the discount rate differs. Distant expected cash flows can therefore be sensitive to required returns.
That does not mean every growth company reacts alike, or that a low-P/E value stock is inflation-resistant. Profitability, balance sheets, pricing power, capital intensity and starting valuations matter. Compare the exposures in VOO versus QQQ before applying one inflation narrative to very different portfolios.
Inflation, Bonds and Cash: Different Mechanisms
Many bonds promise fixed nominal payments. Unexpected inflation reduces their purchasing power. If investors demand higher yields, the present value of existing fixed cash flows generally falls. Expected inflation matters, but real yields, term premiums, credit and liquidity also influence bond prices.
A first-order duration approximation is percentage price change ≈ −modified duration × yield change, with the yield change expressed as a decimal. A modified duration of five and a one-percentage-point yield increase imply approximately −5% price change, before income and ignoring convexity and other effects. It is not an exact total-return forecast.
Cash has different trade-offs. A $25,000 account earning 2% becomes $25,500 before tax. With 4% inflation, that is approximately $24,519 in starting-date dollars. Interest was earned, yet purchasing power declined.
Cash can still fund emergencies and near-term obligations without forcing a sale of volatile assets. Inflation and investing decisions should value that liquidity while recognizing its cost. Compare after-cost or after-tax income with the inflation measure relevant to the goal; nominal stability and real preservation are different.
The illustration compares three separate hypothetical mechanisms. It does not rank expected stock, bond and cash returns. The bond example uses a yield-change assumption; the cash example uses a separate inflation assumption.
Dividends Are Not Automatically Inflation-Adjusted
A company can maintain a dividend while its purchasing power falls. A fixed $5,000 annual payment is worth approximately $3,378 in today’s dollars after ten years at 4% inflation—a loss of about 32.4% in purchasing power.
Dividend growth can help if it is supported by earnings and cash flow. It is not guaranteed, and a high yield can reflect a falling price or elevated risk. Inflation and investing analysis should examine payout sustainability, debt and total return alongside current income.
Read what dividend yield measures, dividend yield versus total return and SCHD explained. An income strategy is not an automatic purchasing-power guarantee.
TIPS: Inflation-Linked Principal With Market Risk
U.S. Treasury Inflation-Protected Securities adjust principal using their specified CPI measure. TreasuryDirect lists 5-, 10- and 30-year terms. The fixed coupon rate applies to adjusted principal, so the dollar interest payment can change as principal changes.
For a simplified example, a $10,000 principal rising 3% through the applicable adjustment becomes $10,300. At maturity, Treasury pays the greater of inflation-adjusted principal or original principal under the security’s terms. The floor concerns original principal, not necessarily a higher purchase price paid in the market.
Before maturity, market prices fluctuate, including when real yields change. A TIPS ETF can also lose value and does not give each shareholder the same personal maturity-date floor as an individual security. Its holdings and duration require examination.
TIPS address a specified U.S. inflation measure rather than every household’s costs. Foreign investors also face currency and jurisdiction considerations. In applicable U.S. taxable accounts, interest and principal adjustments can have tax consequences even when an adjustment has not been paid out in cash. Account type and local rules matter.
Understanding inflation and investing therefore means distinguishing contractual inflation linkage from a promise that market value cannot fall.
Real Estate, Gold and Commodity Exposure
Property rents and replacement costs can respond to prices, but expenses, regulation, local demand and financing affect the result. Higher required returns or borrowing costs can pressure valuations. Leverage can create cash-flow stress even when an asset has some long-term inflation sensitivity.
Gold responds to several influences, including real interest rates, currencies and investor demand. It does not generate business earnings or contractual interest. Energy producers can benefit from higher selling prices but still face operating costs, capital requirements and market risk.
Commodity funds can use futures rather than physical assets. Roll returns, collateral income, fees and futures-curve changes can cause performance to differ from a simple spot-price story. For inflation and investing, the product’s actual structure matters more than the word hedge.
No asset in this group tracks household consumer prices perfectly or provides guaranteed protection in every holding period.
Inflation and Foreign-Currency Investments
Inflation differences can influence currencies, but do not provide a reliable exchange-rate forecast by themselves. Interest rates, policy, capital flows and growth expectations also matter. Currency hedging can reduce certain exposures while introducing costs and tracking differences.
For a Canadian investor holding U.S. assets, first convert the investment result into Canadian dollars before comparing it with a relevant Canadian price index. If the U.S.-dollar investment return is r and the change in Canadian dollars per U.S. dollar is f, the unhedged Canadian-dollar factor is (1 + r) × (1 + f), before costs and taxes.
A weaker Canadian dollar can lift that translated value; a stronger one can reduce it. The ETF’s trading currency alone does not establish its underlying currency exposure or whether it is hedged. Inflation and investing comparisons need consistent currency units.
Inflation and Retirement Planning
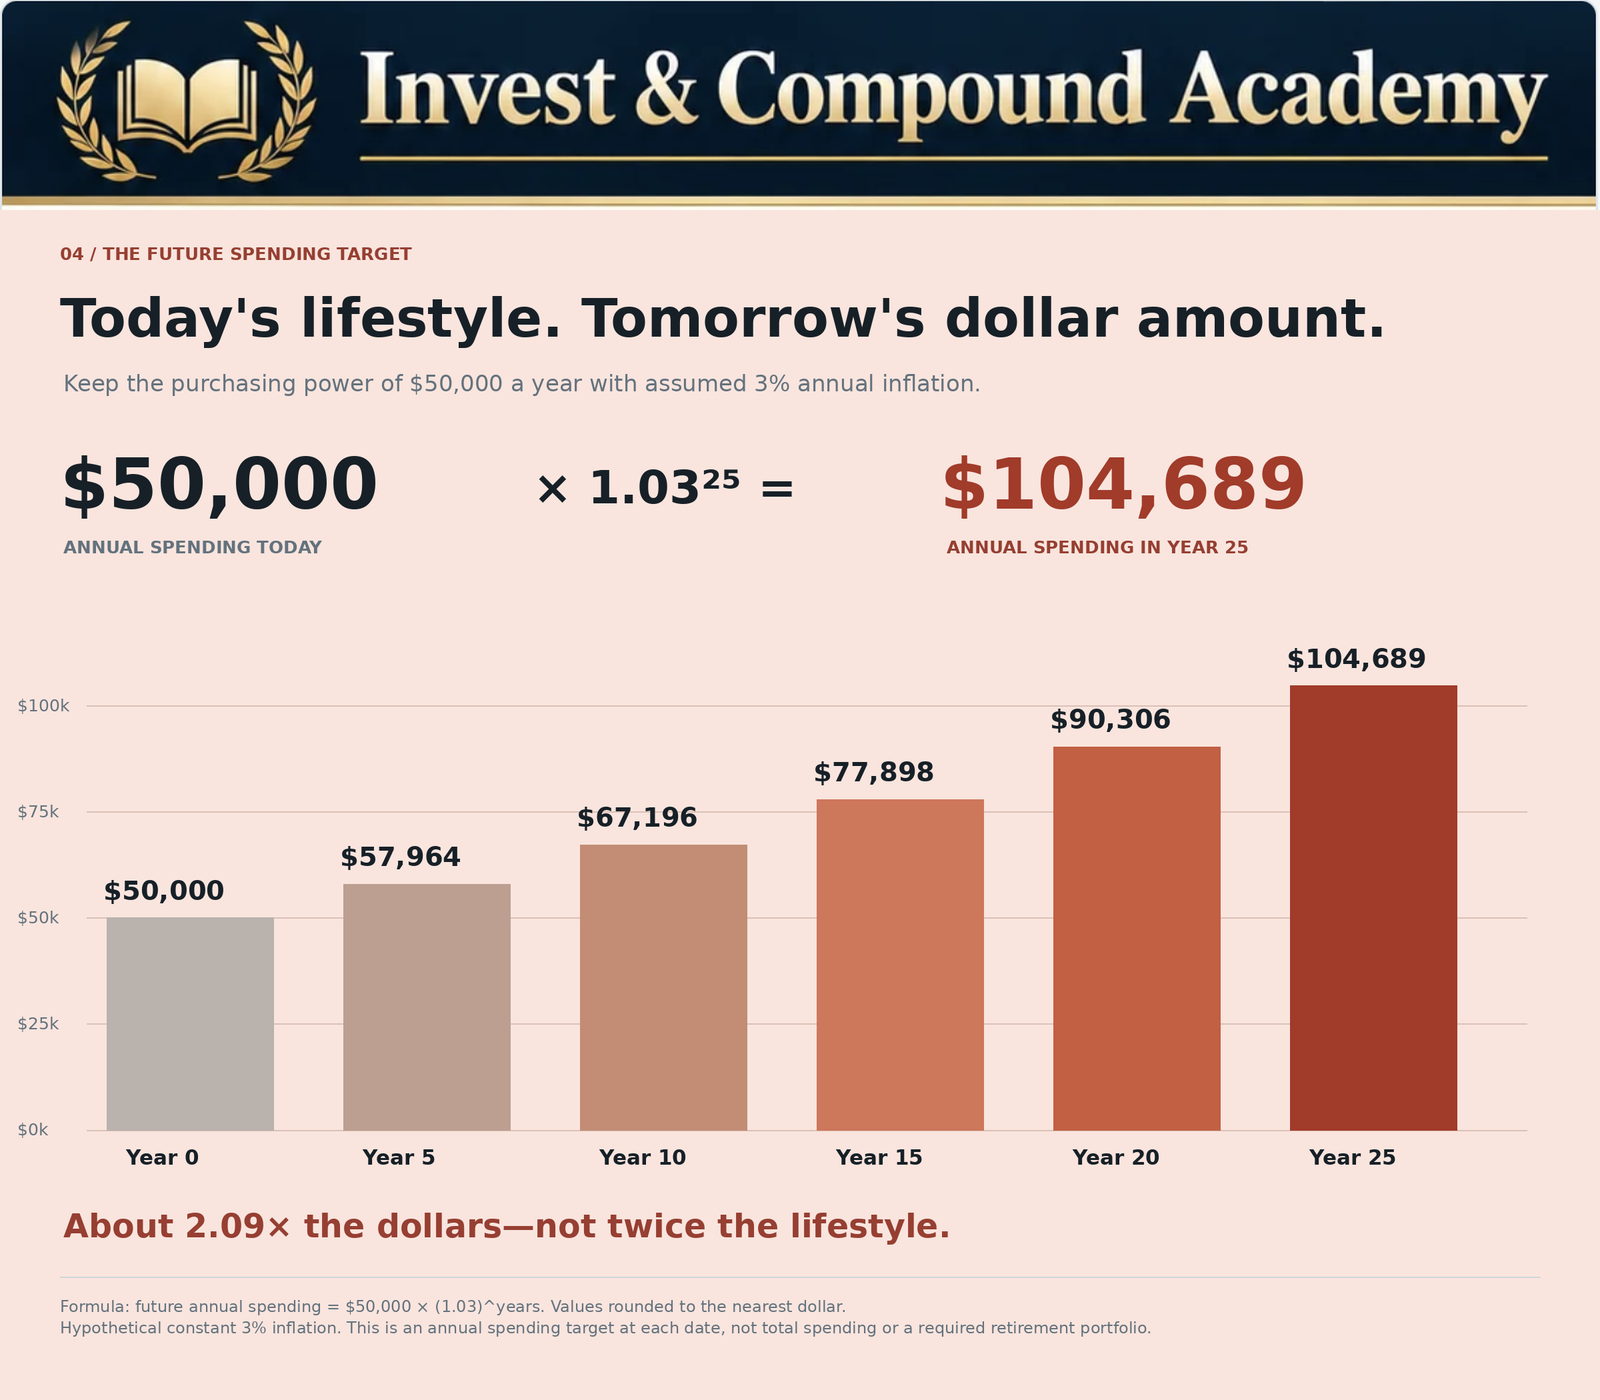
Spending objectives stated in today’s dollars must be converted before comparison with a future nominal portfolio. A target of $50,000 a year today becomes approximately $104,689 a year after twenty-five years at constant 3% inflation.
That is an annual spending target at the future date, not a retirement account size or the total cost of twenty-five years of spending. The real lifestyle target is unchanged. The nominal number of dollars is approximately 2.09 times larger.
Inflation and retirement planning remain connected after withdrawals begin. A $60,000 first-year budget, adjusted upward ten times by 3%, becomes approximately $80,635 in year eleven. The number of adjustments matters; ten years of changes is not eleven.
Pensions and other income sources have different indexing rules. Review whether adjustments are full, partial, capped or absent. Housing, health care and family circumstances can also change personal spending independently of the headline index.
Inflation and investing become particularly important when early retirement losses coincide with rising nominal withdrawals. Our guide to compounding with withdrawals examines return-sequence effects. Market recovery definitions in the S&P 500 correction statistics guide do not automatically describe an individual’s inflation-adjusted recovery after spending.
Inflation and Debt Obligations
Inflation can reduce the purchasing power represented by fixed nominal principal. That does not automatically improve a borrower’s finances: wages may lag, living expenses may rise and payment obligations still have to be met.
Fixed-rate borrowing can behave differently from variable-rate debt or loans due for refinancing. For companies, maturities, interest coverage, liquidity and the capacity to raise prices matter. Inflation and investing risks should be evaluated alongside the household’s or business’s liabilities, not only its assets.
Our economic recession pillar explains why income, credit conditions and financial obligations can deteriorate together even when a debt balance is declining in real terms.
How Inflation Affects ETF Strategies
An ETF is a wrapper, not a single inflation exposure. Broad equity funds hold businesses with different pricing power; growth funds can be sensitive to discount rates; dividend funds depend on sustainable distributions; bond funds combine duration and credit exposures.
Covered-call income is not automatically indexed to inflation. These strategies retain underlying downside risk and may surrender some upside. Compare JEPI explained, JEPQ explained and SPYI explained, then review the covered-call financial reports guide for distribution and investment-result distinctions.
TIPS funds introduce inflation-linked securities but retain market-price risk. For all funds, inspect holdings, strategy, expenses and currency exposure. The ETF research guide, S&P 500 index explanation and VOO/VTI overlap review help identify what a portfolio actually owns.
Inflation and investing outcomes depend on those economic exposures, not on how many ticker symbols appear on a statement.
An Inflation-Aware Planning Framework
- State the spending goal in today’s dollars and identify the relevant currency.
- Test several inflation assumptions rather than treating one as a forecast.
- Convert future nominal investment values back into the same purchasing-power units.
- Examine fees, taxes, distribution policy and cash flows separately.
- Match liquidity and asset risk to the dates on which money may be needed.
- Review pricing power, duration, credit, currency and concentration rather than relying on broad hedge labels.
- Revisit assumptions when goals or circumstances change, without treating every monthly release as a trading instruction.
Use ETF portfolio construction, the portfolio maintenance workbook and whole-share rebalancing to connect inflation and investing assumptions with an implementable portfolio process.
Inflation can also affect earnings expectations and discount rates without creating a fixed market schedule. The earlier market-correction pillar, correction versus bear-market comparison and bear-market guide explain the price-based classifications. Compare historical corrections, warning signs and correction frequency without assuming they forecast the next inflation release.
Recovery can take different lengths of time, as the correction-duration guide and bear-market duration guide explain. For decisions during a decline, use what to do during a correction and buying during a correction alongside your liquidity and valuation review.
Inflation Calculator: Future Cost and Purchasing Power
The first calculator answers two separate questions using the same amount. It shows the future nominal cost of today’s basket and the future purchasing power of a fixed balance. Those are alternative interpretations of the input, not two balances to add together.
For example, $100,000 over ten years at 4% inflation has purchasing power of approximately $67,556 in today’s dollars if it earns nothing. The tool also permits a deflation scenario within its input range. Neither a positive nor a negative assumption is a forecast.
Inflation-Adjusted Investment Return Calculator
The second calculator compounds a lump sum at an assumed annual nominal return, then adjusts the ending value for inflation. It also shows the annual real-return assumption and cumulative change in purchasing power.
At $20,000, 8% nominal growth, 3% inflation and fifteen years, nominal future value is approximately $63,443, and purchasing power is approximately $40,722 in today’s dollars. Calculations use full precision before rounding. This is a scenario, not an expected-return estimate.
Both calculators assume constant annual rates and no fees, taxes, contributions, withdrawals or separate distributions. Inflation and investing models simplify reality: actual annual paths vary, and a quoted total return should already include any reinvested distributions assumed in that return.
Common Misconceptions About Inflation and Investing
Falling positive inflation means prices are increasing more slowly, not falling. A positive nominal investment result does not establish a positive real result. A national price index does not capture every household’s personal spending changes.
Cash provides useful liquidity but can lose purchasing power. Stocks do not always beat inflation, bonds are not automatically poor investments, and TIPS funds can lose market value. Dividend yield, property ownership and gold exposure are not universal inflation guarantees.
The useful question in inflation and investing is how a particular asset’s cash flows, costs and valuation interact with the price environment and the investor’s obligations.
Frequently Asked Questions
What is inflation in simple terms?
It is an increase in the general price level over time, usually reducing what a unit of currency can purchase. A selected price index measures the change for its defined scope and period.
Why does lower inflation not mean lower prices?
A positive rate still raises the price level. Moving from 8% to 3% inflation is disinflation; a negative rate is needed for the measured price level to decline.
What is the difference between CPI and PCE?
They differ in coverage, weights and statistical methods. The Federal Reserve states its longer-run inflation objective using PCE, while CPI is widely used for consumer price comparisons and contractual adjustments.
Does core inflation exclude expenses that households need?
It commonly excludes food and energy to help study underlying trends. It does not claim those costs are unimportant or avoidable.
Is real return nominal return minus inflation?
That is an approximation. The exact formula is (1 + nominal return) ÷ (1 + inflation) − 1, using rates for the same period.
Can an investment gain dollars but lose purchasing power?
Yes. A 3% nominal gain with 5% inflation produces approximately a 1.90% real loss before fees and taxes.
Do stocks automatically protect against inflation?
No. Pricing power can help, but costs, financing needs, valuation and investment horizon matter. Inflation and investing outcomes vary across companies and periods.
Why can existing bond prices fall when yields rise?
Higher required yields generally reduce the present value of fixed future cash flows. Duration estimates sensitivity; structure, convexity and credit add further considerations.
Can TIPS or TIPS ETFs lose money?
Their market prices can fall. An individual security’s maturity terms differ from an ETF shareholder’s exposure, and the original-principal floor is not a promise to recover any purchase premium or match a personal spending basket.
How does inflation affect retirement planning?
It increases future nominal spending needed for a given real lifestyle. Withdrawal timing, other income, indexing rules and market losses also affect the plan.
Does inflation make debt easier to repay?
It can reduce the real value of fixed nominal debt, but income growth and interest-rate terms determine whether cash-flow affordability improves.
Does a foreign investment need a local inflation adjustment?
If the spending goal is in local currency, translate the investment result into that currency before deflating it with an appropriate local price measure. Currency movements can amplify or offset the investment return.
What is the best investment during high inflation?
There is no universal answer. Inflation and investing decisions depend on the cause of inflation, valuations, product terms, time horizon, taxes and financial obligations.
Measuring Investment Progress in Purchasing Power
Inflation and investing cannot be separated by reading a statement balance alone. Nominal growth tells you how many dollars you hold; a real-value calculation helps explain what those dollars can buy relative to a chosen price index.
Use consistent periods and currency units, examine actual asset exposures and test several assumptions. A plan that recognizes uncertain inflation, market losses and cash needs is more useful than treating a headline yield or one projected balance as a complete measure of success.
Explore the Earlier Market-Risk and Economic Pillars
Connect purchasing power with the twelve earlier pillars on business cycles, market declines, historical evidence and portfolio decisions.
Continue Learning in the Invest & Compound Academy
Connect inflation and investing with economic cycles, compounding, measurement and the distinction between income and total return.
Inflation, economic cycles and portfolio strategy
Market Correction Pillar | Indexes and Markets | Portfolio Construction
Sources and Further Reading
Reference review: October 18, 2026. U.S. price-index, monetary-policy and Treasury examples use the cited official resources. No current inflation reading or investment forecast is presented. Chart scenarios, return examples and calculator defaults are hypothetical. Dollar results use full-precision calculations before display rounding; currency units must be consistent when applying the examples.
- Bureau of Labor Statistics: Consumer Price Index FAQs — scope, methodology, core measures and household differences.
- Bureau of Economic Analysis: Differences Between the PCE Price Index and the CPI.
- Bureau of Economic Analysis: Personal Consumption Expenditures Price Index.
- Federal Reserve: Statement on Longer-Run Goals and Monetary Policy Strategy — longer-run 2% PCE inflation objective.
- TreasuryDirect: TIPS — principal adjustments, coupon payments, maturity treatment and tax notes.
- SEC Investor.gov: Bonds — inflation, interest-rate and other investment risks.
- Federal Reserve Bank of St. Louis / FRED: Constructing “Ex Ante” Real Interest Rates — exact nominal-to-real growth-factor relationship.
- SEC Investor.gov: Asset Allocation and Diversification.
This article provides general financial education and information, not personalized investment, financial, legal or tax advice or a recommendation to buy, sell or hold a security.
Constant inflation and return assumptions illustrate mathematical relationships, not future outcomes. Personal spending can differ from an official price index. Fees, taxes, cash flows, exchange rates, product terms and market volatility can change realized purchasing power. Inflation-linked securities and funds retain relevant market and structural risks.
Investments can lose principal permanently. Diversification and asset allocation do not guarantee profits or eliminate market risk. Past performance does not guarantee future results. Consider your financial circumstances and consult qualified professionals where appropriate.


