QYLD ETF guide. Yield, payouts and holdings in one place.
QYLD holds the Nasdaq-100 stocks and sells call options on the index to pay a high monthly income. See what it costs to hold each year, what it pays, what sits inside and how it has returned.
One ticker.
What QYLD is, in plain words.
QYLD holds the Nasdaq-100 stocks and sells call options on the index to pay a high monthly income. The fund is managed by Global X, trades on Nasdaq in U.S. dollars and launched on Dec 11, 2013. On Nov 10, 2026 it held $8.06B in net assets and its expense ratio was 0.60%. QYLD is a long running monthly income fund built on the Nasdaq-100.
Investors search for QYLD ETF because they want a clear answer to four practical questions. What does it cost to hold each year, what does it pay, what is actually inside, and how does it fit in a Roth IRA, a traditional IRA or 401(k), or a taxable account. This guide answers each one with dated figures from the issuer, and marks anything the issuer page does not publish as Not captured.
Key takeaways
- What it is. QYLD holds the Nasdaq-100 stocks and sells call options on the index to pay a high monthly income.
- Cost. Expense ratio 0.60%, about $60 a year on $10,000.
- Income. Trailing yield 12.87%, paid monthly.
- Risk. Stock funds can fall sharply in a weak year.
It suits you if
- You want a high monthly cash payout from your holdings.
- You accept giving up part of the gains when stocks rally.
- You understand the payout can change from month to month.
Look elsewhere if
- You want the most growth from a rising stock market.
- You want a payout that stays the same each month.
- You need a low cost fund, since fees are higher than for plain index funds.
What QYLD holds.
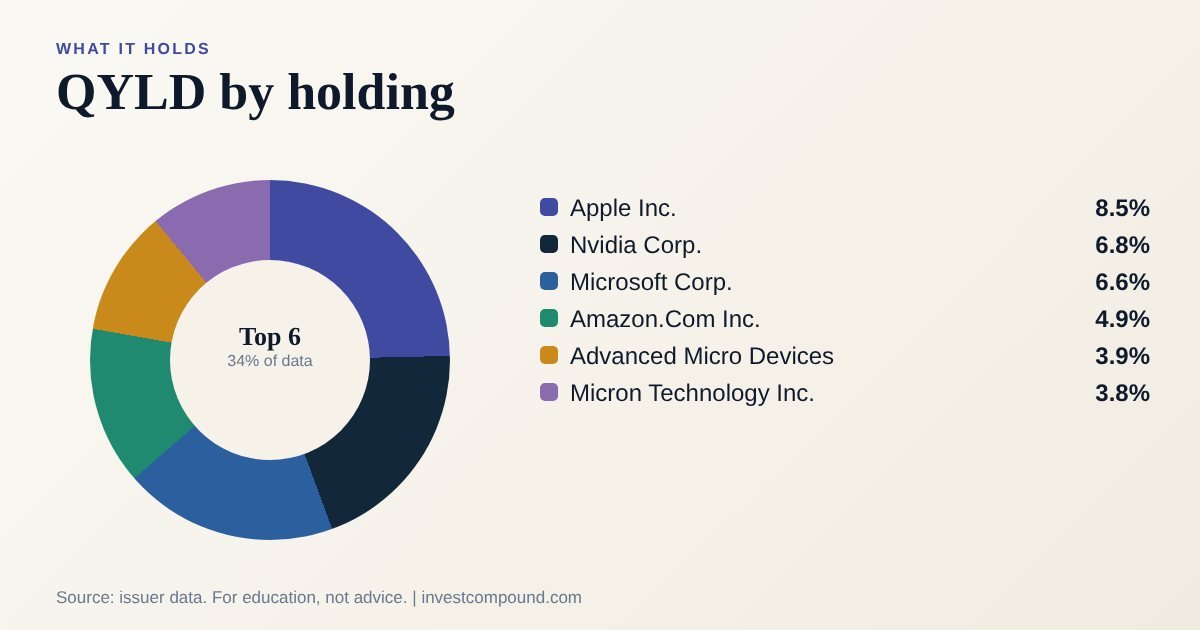
The 10 largest stock positions inside QYLD, as of Nov 10, 2026. Pick a number to see how much of the fund they make up.
The ten largest holdings are shown below from the issuer page. They are mostly very large U.S. companies, but the option positions that generate the extra income are not stocks and do not appear in the table, so the table shows only part of what the fund owns.
QYLD yield and distributions.
QYLD pays distributions as a monthly payer according to the issuer. The yield shown on the issuer page was 12.87% dated Nov 10, 2026. The distribution log with exact dates and amounts was Not captured for this fund, so use the issuer page for payment dates.
A yield is a snapshot, not a promise. The payment moves with the dividends and interest the fund receives, and some years include capital gains or return of capital that do not repeat.
Every payment, and the year by year record.
The payment log and annual tax breakdown were Not captured for this fund, because the issuer data we use publishes them only as a downloadable file. The issuer page lists every payment date and amount.
What QYLD costs to hold each year.
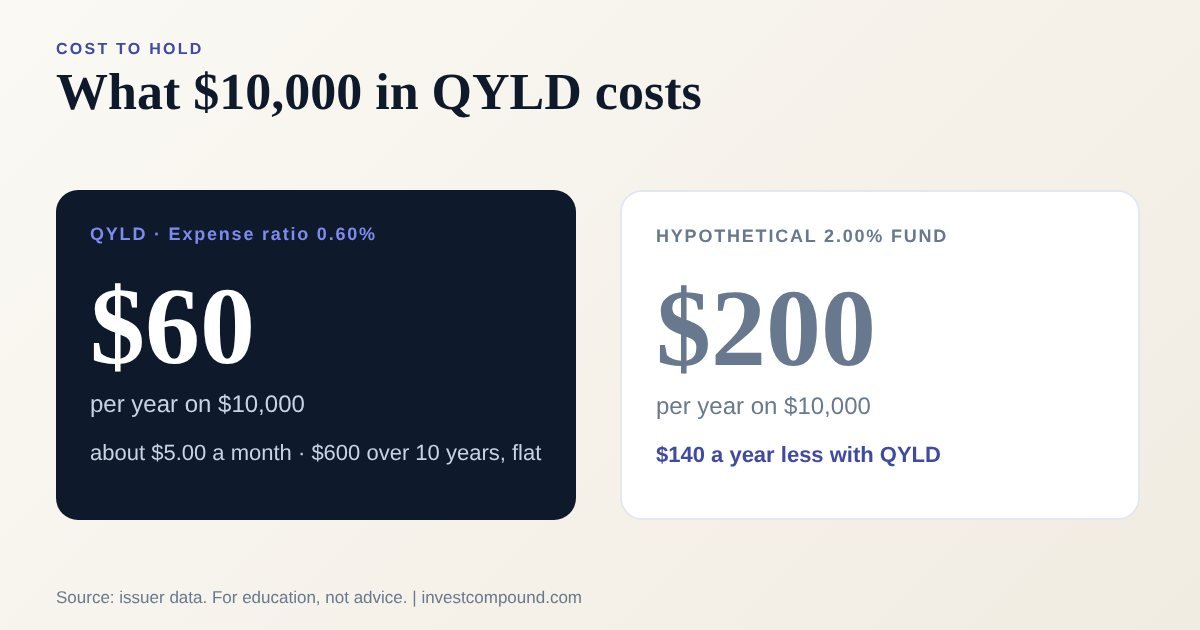
The expense ratio of 0.60% means the fund keeps about $60 a year for every $10,000 you hold. That cost is taken out of the fund price in small daily amounts, so you never see a bill, but it lowers your return every year. Over ten years on a flat $10,000 the expense ratio adds up to roughly $600, before any growth.
Two other costs sit outside the expense ratio. Trading commissions depend on your brokerage, and most large U.S. brokerages now charge nothing to buy ETFs. The bid and ask spread is a small cost you pay each time you trade, and for the largest funds it is usually tiny.
Expense ratio cost at common amounts
| Amount held | Per month | Per year | Over 10 years, flat | Hypothetical 2.00% fund, per year |
|---|---|---|---|---|
| $1,000 | $0.50 | $6.00 | $60 | $20 |
| $5,000 | $2.50 | $30.00 | $300 | $100 |
| $10,000 | $5.00 | $60.00 | $600 | $200 |
| $25,000 | $12.50 | $150.00 | $1,500 | $500 |
| $50,000 | $25.00 | $300.00 | $3,000 | $1,000 |
| $100,000 | $50.00 | $600.00 | $6,000 | $2,000 |
| $250,000 | $125.00 | $1,500.00 | $15,000 | $5,000 |
Flat estimates at the current expense ratio with no growth and no change in fee. Trading commissions depend on your brokerage and are not included. The 2.00% fund is a hypothetical used for scale.
Where the cost shows up
- Not as a bill. The share price and returns are already lower by the expense ratio.
- Trading cost shows up as the bid and ask spread each time you buy or sell, and as a commission if your broker charges one.
- In a taxable account, dividends are reported on Form 1099-DIV and taxed in the year they are paid.
Expense ratio cost calculator
Flat estimate at an expense ratio of 0.60% with no growth and no change in fee. It shows scale only, not a forecast.
How QYLD has returned.
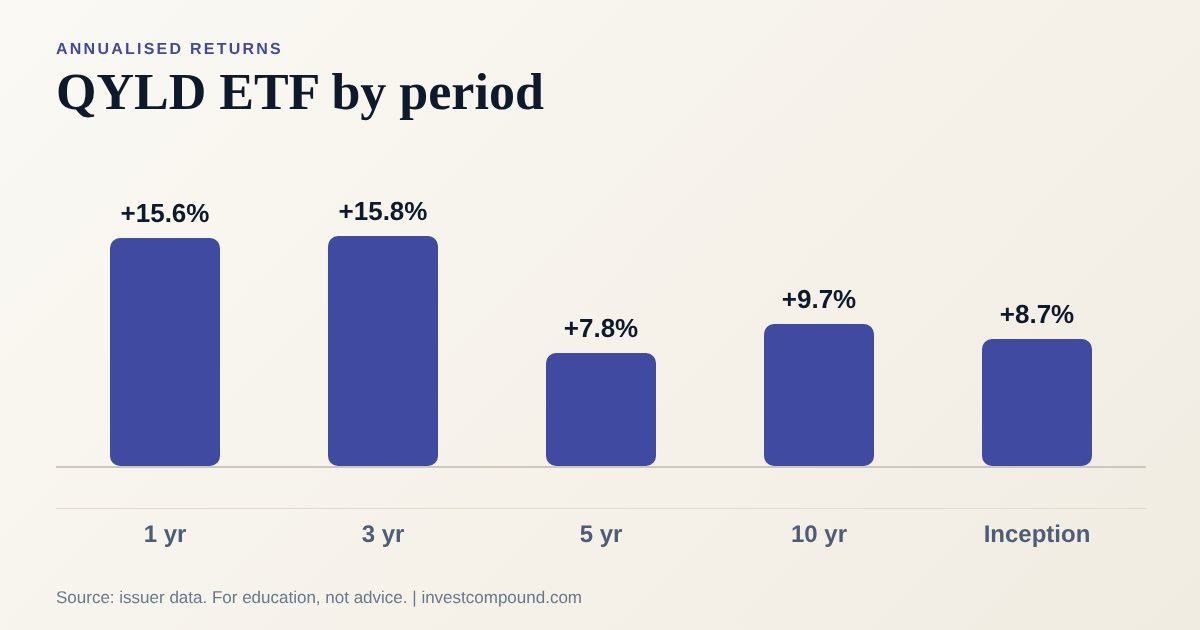
Calendar year returns were Not captured from the issuer page for this fund, so this guide shows the period returns the issuer publishes. Returns include fees. Past performance does not guarantee future results, and a single period tells you little about the next one.
Annualised NAV returns from the issuer, as of Oct 31, 2026. They include fees.
Past performance does not guarantee future results. Gaps are shown as Not captured because the issuer page did not publish that period.
QYLD fund facts in one place.
Every figure comes from the issuer for the date shown. A line reads Not captured when it is not published on the pages we use.
Where the companies are.
Country exposure as published by the issuer.
What the ride can look like.
QYLD can lose value, and the calendar year record shows the range so far.
- Market risk. The fund still falls when U.S. stocks fall, and the options soften only part of the decline.
- Capped upside. Sold call options limit the gains in a strong rally.
- Payout risk. Monthly payments change with market volatility and are not guaranteed.
- Return of capital. Part of a payout can be your own money returned to you, which lowers your cost basis.
- Concentration. A few very large technology companies carry a high share of the weight.
How investors use QYLD.
QYLD is used by investors who want regular cash from a stock portfolio and are willing to trade away some growth for it. A common approach is to hold it in an IRA, where the payout is not taxed each year, and to keep a plain index fund for growth in another account.
Compare the yield with the fund return over time, not only with the payout. A high yield that comes with a falling share price is not free income, so look at the total return in the returns section.
Before buying QYLD, check four things on the issuer page. First, confirm the expense ratio matches the figure on this page, since fees can change when an issuer cuts costs. Second, confirm the fund is eligible for the account you plan to use. Third, read the latest tax breakdown if you hold it in a taxable account. Fourth, look at the bid and ask spread on the day you trade, since a wide spread is a cost that the expense ratio does not show.
Several comparable funds exist, with expense ratios of JEPQ at 0.35%, SPYI at 0.68%, JEPI at 0.35%, XYLD at 0.60%, so weigh cost together with what each fund holds, how it pays and the account you use.
No single fund is right for everyone, and this guide describes the product rather than recommending it. The figures come from the issuer and are dated. Distribution amounts, yields and holdings change, and past returns do not predict future returns. For a decision with large amounts of money, read the prospectus and the shareholder reports, and consider speaking with a licensed adviser about your own situation.
QYLD against similar funds.
The same fund type from other issuers. Open a comparison for holdings overlap and returns.
| Fund | Issuer | Expense ratio | Net assets | Trailing yield |
|---|---|---|---|---|
| QYLD (this fund) | Global X | 0.60% | $8.06B | 12.87% |
| JEPQ | J.P. Morgan | 0.35% | $41.78B | 11.87% |
| SPYI | NEOS | 0.68% | $12.58B | 11.43% |
| JEPI | J.P. Morgan | 0.35% | $46.80B | 8.01% |
| XYLD | Global X | 0.60% | $3.34B | 10.86% |
| DIVO | Amplify | 0.56% | $8.01B | 4.85% |
| QQQI | NEOS | 0.68% | $14.78B | 14.13% |
QYLD is part of the Covered Call Income ETFs category on this site, grouped here with JEPQ, SPYI, JEPI. Each comparison page lines up two funds on cost, holdings overlap, yield and returns, so you can see what separates them.
Where QYLD fits.
Qualified withdrawals from a Roth IRA are tax free, so dividends and gains compound without a yearly tax bill and the expense ratio is the main drag you carry. QYLD is an ordinary exchange traded fund, so most brokerages let you hold it in a Roth IRA.
Tax is deferred until you withdraw, and withdrawals are taxed as ordinary income. A 401(k) offers only the funds on its menu, so check whether QYLD or a similar fund is in your plan.
The payout mixes dividends, option income and sometimes return of capital, so a large share can be taxed at ordinary rates. Your broker reports the split on Form 1099-DIV. Your broker reports the amounts on Form 1099-DIV after year end, and those figures are what count on your return. ETFs also tend to pass out few capital gains because of how shares are created and redeemed.
General education, not tax advice. Rules change, so confirm with the issuer tax documents or an adviser.
Buying QYLD in five steps.
- Pick the account. Roth IRA, traditional IRA, 401(k) or taxable. Most brokerages let IRAs hold ETFs like this one.
- Search the ticker. Type QYLD in your brokerage and choose the U.S. listing, priced in U.S. dollars.
- Use a limit order. It sets the most you will pay and avoids surprises at the open.
- Check the cost. Most large U.S. brokerages charge no commission on ETFs, and some charge a small fee per trade.
- Set a routine. Add money on a schedule and decide whether to reinvest distributions.
Terms used on this page.
Where to go next from QYLD.
Every QYLD link in one place. Start with the category, then the head to head comparisons, then the guides for other funds and the tools.
CategoryCovered Call Income ETFsEvery fund in this category, with a comparison page for every pair.Open the category →QYLD comparison pages 5
Guides for similar funds
More U.S. fund guides
Calculators for QYLD investors
Other ETF categories
Guides and research
Common questions about QYLD.
What is QYLD?
QYLD holds the Nasdaq-100 stocks and sells call options on the index to pay a high monthly income. It is managed by Global X, trades on Nasdaq in U.S. dollars and launched on Dec 11, 2013.
What is the expense ratio of QYLD?
The expense ratio of QYLD on the issuer page is 0.60%, or about $60 a year per $10,000 invested.
What is the QYLD dividend yield?
The issuer page showed a trailing yield of 12.87% on Nov 10, 2026 for QYLD. Yields change, so check the issuer page for the current figure.
How often does QYLD pay a dividend?
QYLD pays distributions as a monthly payer. The payment log was Not captured for this fund.
What does QYLD hold?
QYLD holds 102 positions. Its largest positions are Apple Inc., Nvidia Corp., Microsoft Corp..
Can I hold QYLD in a Roth IRA or 401(k)?
Yes for IRAs. QYLD is an ordinary exchange traded fund, so most brokerages let you hold it in a Roth IRA or a traditional IRA. Whether it is available in a 401(k) depends on the funds your plan offers.
How has QYLD performed?
The issuer period returns are shown in the returns section. Returns include fees, and past performance does not guarantee future results.
QYLD or JEPI, what is the difference?
The two funds do a similar job and differ in cost, issuer and holdings. QYLD has an expense ratio of 0.60% and JEPI has an expense ratio of 0.35%. Open the JEPI vs QYLD comparison for holdings overlap, yield and returns side by side.
How is QYLD taxed in a taxable account?
Dividends are reported on Form 1099-DIV. Qualified dividends are taxed at long term rates and the rest as ordinary income. The split changes by year, so use the figures your broker reports.
Source, Global X fund page. All figures are dated as shown. This guide is for education and is not personal advice or an offer to sell.