Dollar-Cost Averaging Explained: Strategy, Benefits and Risks
Understand scheduled purchases, average acquisition cost, paycheck investing and staged lump sums through worked examples and two interactive calculators.
Dollar-cost averaging means investing a consistent amount at regular intervals as prices change. A $500 contribution buys five shares at $100, 6.25 shares at $80 and ten shares at $50. The schedule stays the same; the share count changes.
That can make investing more manageable, but it does not guarantee a profit or a better result than investing available money immediately. The most important question is whether you are investing new savings from each paycheck or gradually deploying cash you already have.
This guide explains average acquisition cost, rising and falling market examples, whole-share restrictions, trading expenses and long-term contribution mathematics. Two calculators let you test the purchase ledger and an inflation-adjusted accumulation scenario. All worked price paths are hypothetical.
What Is Dollar-Cost Averaging?
Dollar-cost averaging is an investment strategy in which an investor commits a consistent dollar amount to an investment at regular intervals, regardless of market price movements. The U.S. Securities and Exchange Commission’s Investor.gov describes the method as investing equal portions of money at regular intervals regardless of the market’s ups and downs. For example, an investor might purchase $200 of an ETF every week or invest $1,000 into a diversified portfolio on the first business day of each month. The contribution amount and schedule are established in advance.
Investment prices determine the number of shares purchased.
The Essential Components
A conventional dollar-cost averaging process has three characteristics. First, the investor establishes a contribution amount. Second, investments occur according to a regular schedule. Third, the purchasing decision does not depend on predicting whether prices will rise or fall over the next few days. The investor may review the strategy periodically, but the contribution schedule itself does not require a new short-term market forecast every month.
What DCA Does Not Require
Dollar-cost averaging does not require purchasing individual stocks. It can be used with eligible ETFs, mutual funds and other investment products. It does not require the investor to increase purchases during market corrections. Nor does it require selling after prices rise. Its defining feature is the consistency of the investment contribution rather than a particular opinion about market direction.
A Contribution Schedule
A simple monthly strategy might look like this:
| Month | Planned contribution |
|---|---|
| January | $500 |
| February | $500 |
| March | $500 |
| April | $500 |
| May | $500 |
| June | $500 |
| Total | $3,000 |
The investor has committed $3,000 over six months. The number of shares acquired depends on the prices at which the orders execute.
For the pooled investments used in these examples, begin with our ETF beginner’s guide and the broader explanation of how ETFs work. The contribution method and the investment vehicle answer different questions.
How Dollar-Cost Averaging Works
The central mathematical principle is that a fixed dollar amount buys a variable number of shares.
For an investment of $500 at a price of $100: $500 ÷ $100 = 5 shares. At a price of $80: $500 ÷ $80 = 6.25 shares. At a price of $50: $500 ÷ $50 = 10 shares. Lower prices increase the number of shares acquired for the same contribution. Higher prices reduce the number. This does not mean the investor automatically makes money when prices decline. It means the investor accumulates units of the investment according to a consistent contribution rule.
A Complete Six-Month Example
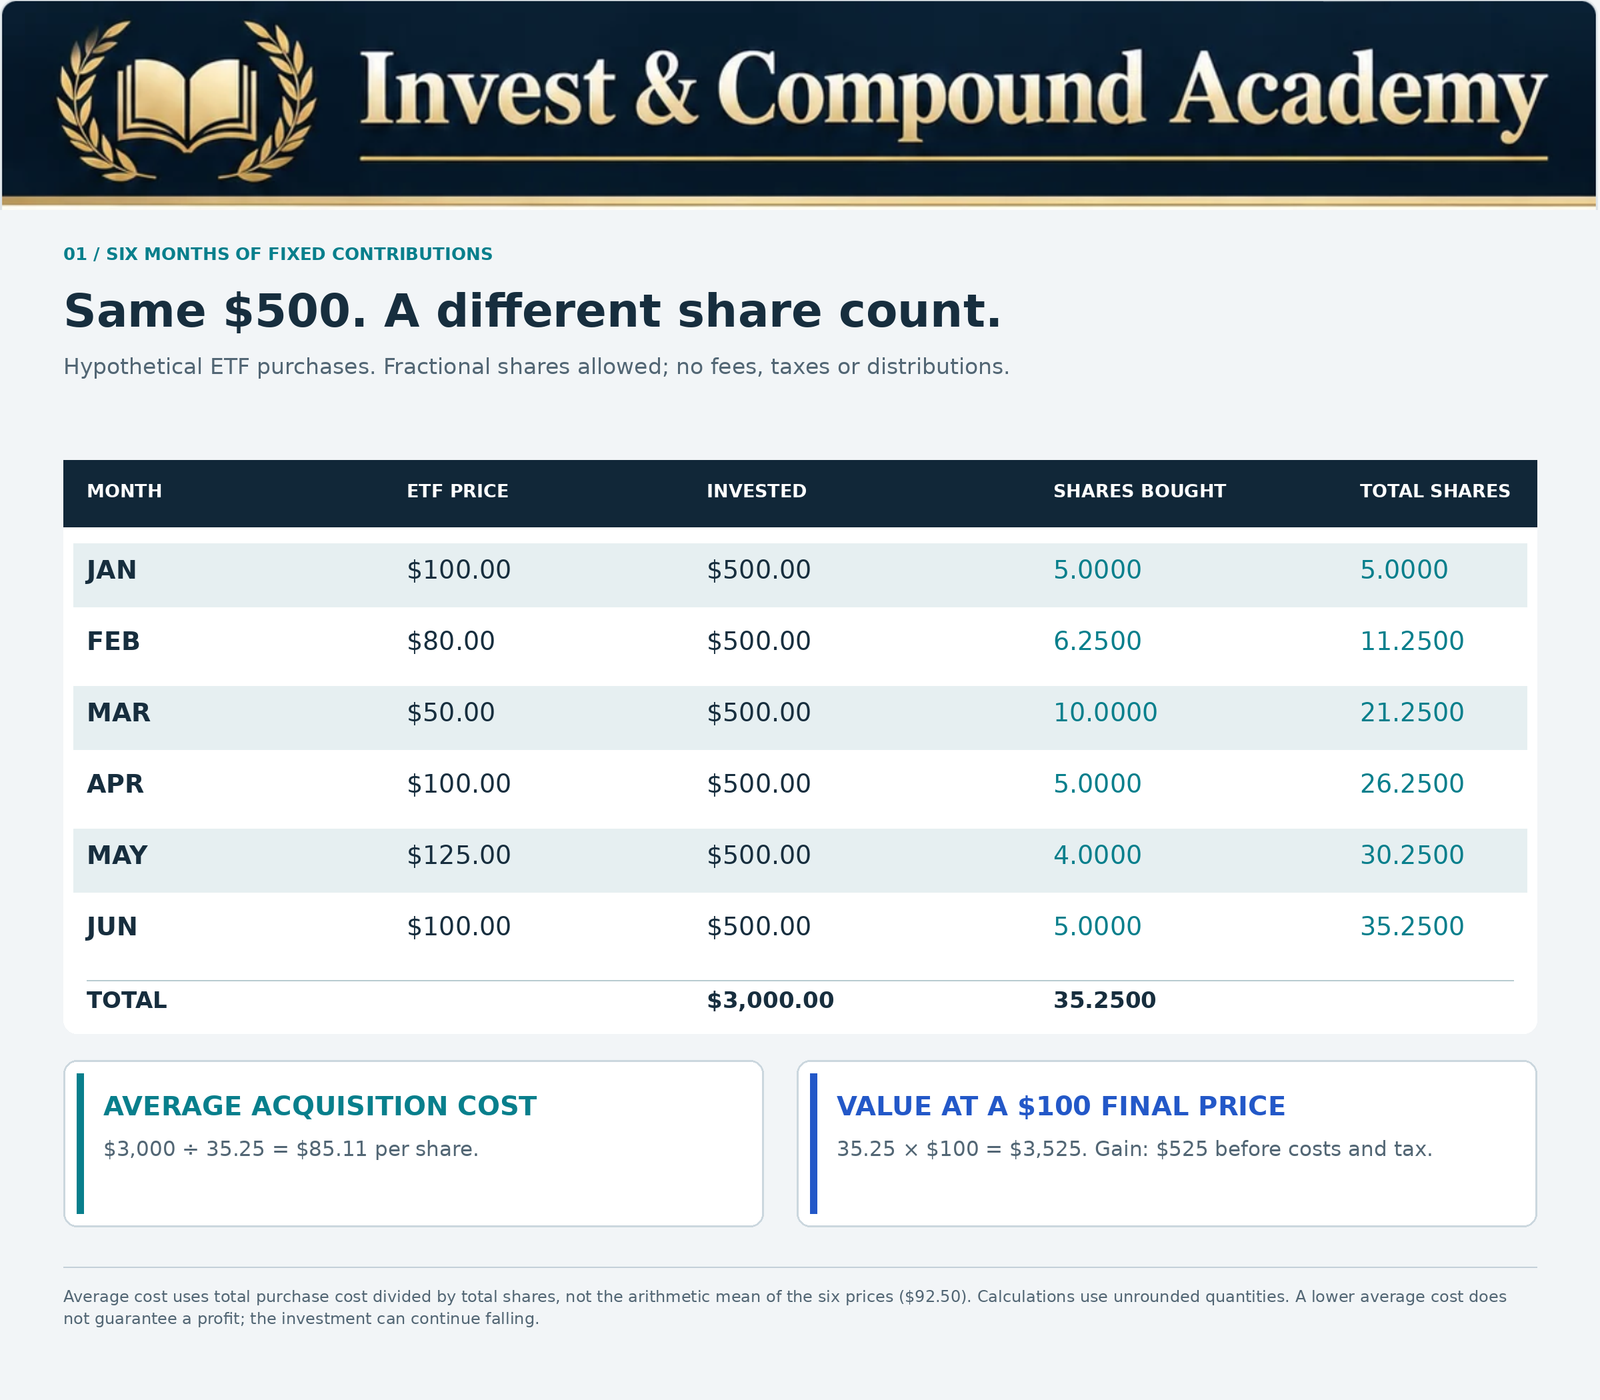
Suppose an investor contributes $500 each month to a hypothetical ETF. Fractional shares are assumed to be available.
| Month | ETF price | Contribution | Shares purchased |
|---|---|---|---|
| January | $100 | $500 | 5.0000 |
| February | $80 | $500 | 6.2500 |
| March | $50 | $500 | 10.0000 |
| April | $100 | $500 | 5.0000 |
| May | $125 | $500 | 4.0000 |
| June | $100 | $500 | 5.0000 |
| Total | $3,000 | 35.2500 |
At the end of June, the investor owns 35.25 shares. With the ETF priced at $100, the position is worth $3,525. The investor contributed $3,000. The unrealized gain is $525, excluding fees, taxes and distributions. The unrealized gain equals 17.5% of total contributions. Because the contributions entered at different dates, this is not an annualized or time-weighted return. However, this result depends entirely on the hypothetical price path.
If the price fell to $60 immediately after the June purchase at $100, the same 35.25 shares would be worth only $2,115. Changing the June purchase price itself would change the number of shares acquired. The investor would have an unrealized loss of $885. Dollar-cost averaging changes the purchase pattern. It does not guarantee the outcome.
How to Calculate the Average Cost per Share
One useful measurement in a dollar-cost averaging strategy is the average acquisition cost per share. The calculation is:
Using the six-month example: $3,000 ÷ 35.25 = approximately $85.11 per share. Although the ETF traded at different prices, the investor’s average acquisition cost is approximately $85.11. If the ETF trades at $100 at the end of the period, the current price exceeds the average cost. If it trades at $70, the current price is below the average cost.
Average Purchase Price Is Not the Same as Average Cost
This distinction is frequently overlooked. The six observed ETF prices were: $100, $80, $50, $100, $125 and $100. Their arithmetic average is: $555 ÷ 6 = $92.50. However, the investor’s average cost per share is approximately $85.11. Why are the numbers different? Because the investor purchased different numbers of shares at different prices. More shares were acquired during the lower-price months. For equal dollar contributions, the average cost per share is linked to the harmonic mean of the purchase prices, assuming fractional shares and no costs.
It is not generally equal to the arithmetic average of those prices.
Why the Distinction Matters
An investor who calculates the average of purchase prices without considering quantities may misunderstand the actual acquisition cost. The correct calculation uses total money invested and total shares purchased. Brokerage statements may also report adjusted cost bases according to applicable tax rules. Those figures may differ from a simplified purchase-cost calculation when commissions, distributions, corporate actions or other adjustments are involved.
For cash-flow-aware performance measurement, see how to measure investment growth. Dividing a gain by contributions does not account for how long each contribution was invested.
Dollar-Cost Averaging During a Falling Market
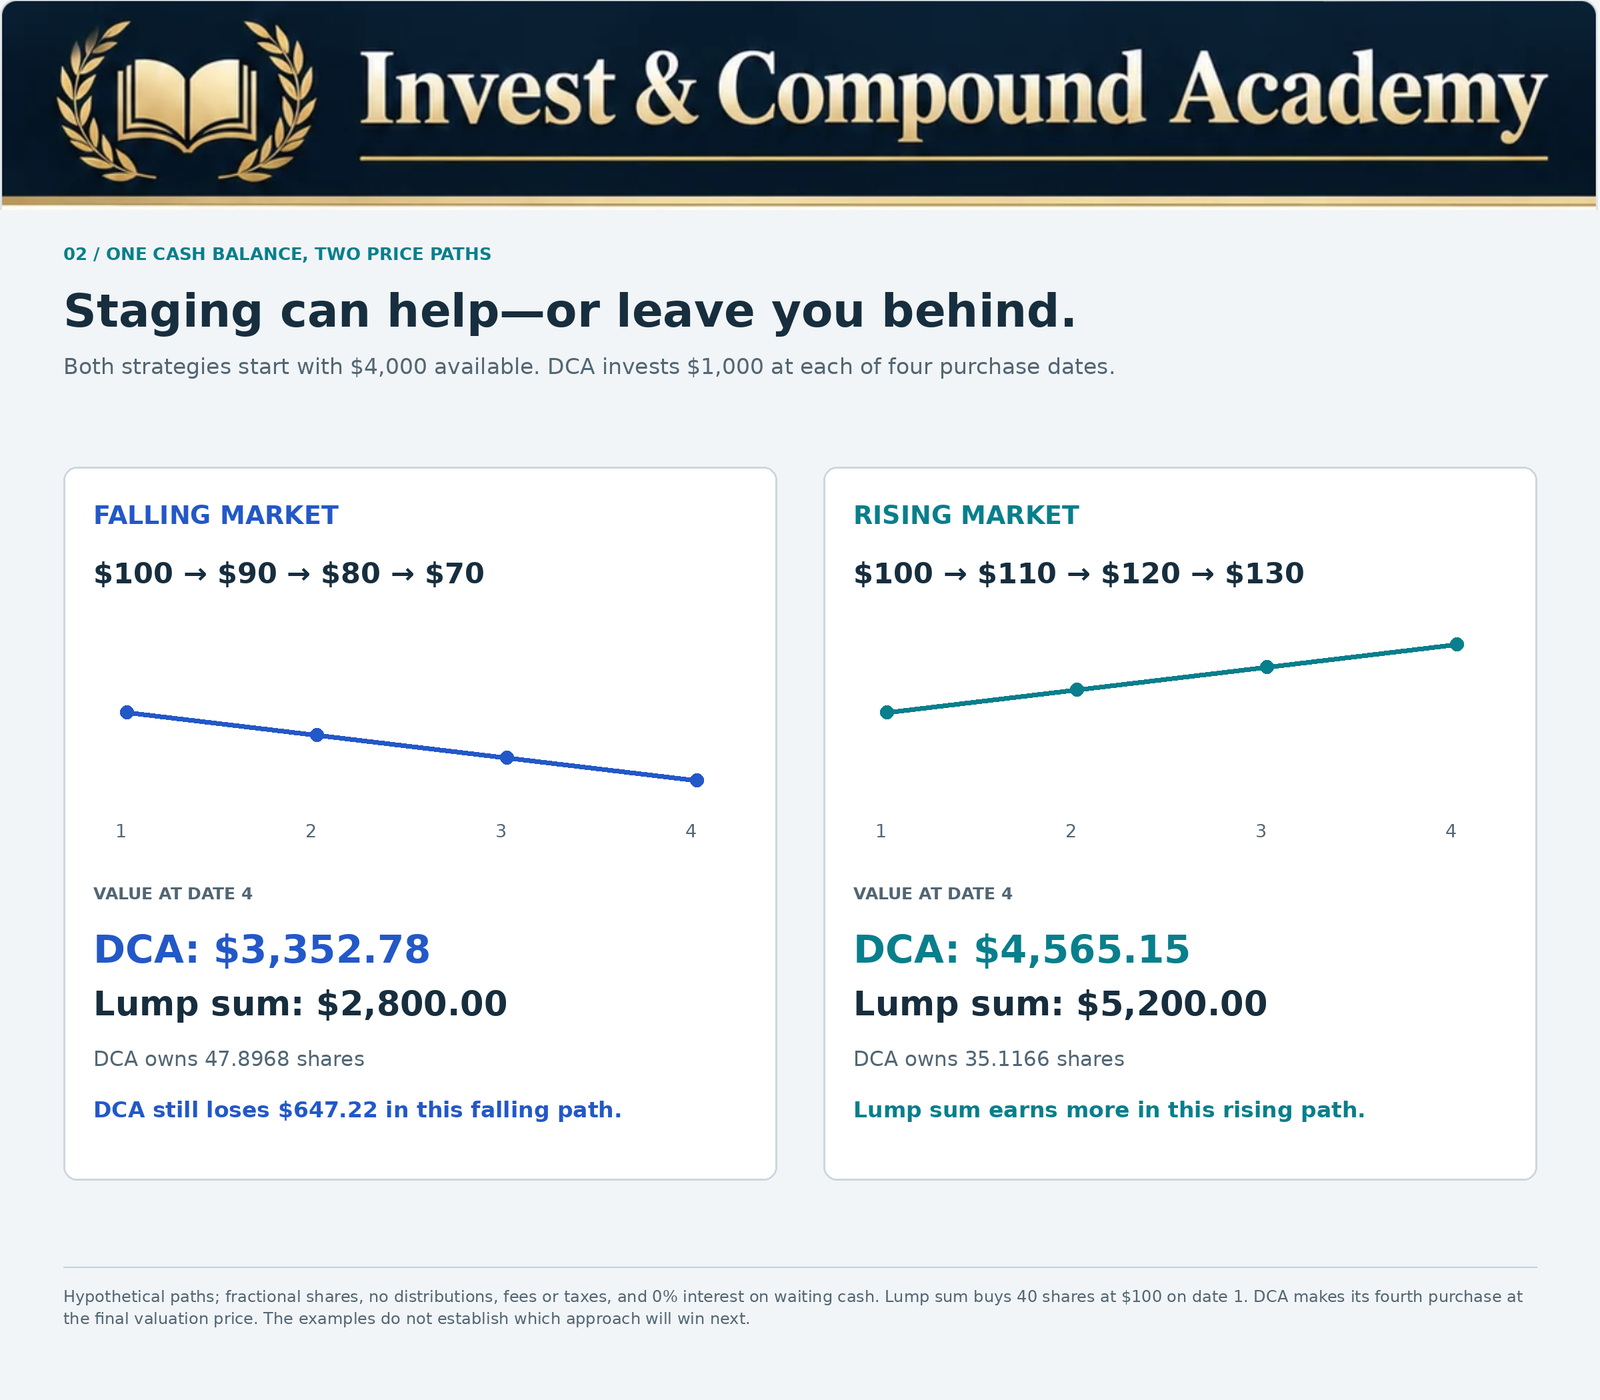
Falling prices create one of the conditions in which dollar-cost averaging can be attractive. Each fixed contribution purchases more shares than the previous contribution when prices decline. However, the accumulated shares also experience market losses. Consider an ETF following this hypothetical path: $100 → $90 → $80 → $70. An investor contributes $1,000 at each price.
| Purchase | ETF price | Shares purchased |
|---|---|---|
| First | $100 | 10.0000 |
| Second | $90 | 11.1111 |
| Third | $80 | 12.5000 |
| Fourth | $70 | 14.2857 |
| Total | 47.8968 |
The investor contributes $4,000. At the final price of $70, the accumulated position is worth approximately $3,352.78. The investor has an unrealized loss of approximately $647.22. The average cost per share is approximately $83.51.
Why Lower Average Cost Does Not Guarantee Profit
The investor acquired additional shares at lower prices. That reduced the average acquisition cost relative to purchasing the same number of shares at the initial $100 price. But the final market price remained below the average cost. The strategy therefore produced a loss. If the ETF later recovered to $100, the accumulated shares would be worth approximately $4,789.68. That favorable outcome requires a subsequent recovery. It cannot be assumed at the time the purchases are made.
The Risk of a Prolonged Decline
Some markets remain weak for extended periods. A diversified ETF can take years to recover previous price highs. An individual company may never recover. Continuing to purchase a declining security can therefore increase exposure to an investment whose value keeps deteriorating. The suitability of regular purchases depends on the quality and diversification of the underlying assets, not simply the mathematical benefit of buying more units at lower prices.
Dollar-Cost Averaging During a Rising Market
Dollar-cost averaging behaves differently when prices increase steadily. Later contributions purchase fewer shares. The investor participates in the market’s gains only to the extent that capital has already been invested. Consider an ETF trading at: $100 → $110 → $120 → $130. An investor contributes $1,000 at each price. The purchases are approximately: 10 shares, 9.0909 shares, 8.3333 shares and 7.6923 shares. The total is approximately 35.1166 shares. At the final price of $130, the accumulated position is worth approximately $4,565.15.
The investor has contributed $4,000 and earned an unrealized gain of approximately $565.15. The strategy generated a positive return. However, compare it with investing the entire $4,000 at the initial $100 price. That immediate purchase would acquire 40 shares. At $130, the position would be worth $5,200. The lump-sum investor would have a larger gain in this hypothetical rising market.
The Opportunity Cost of Delayed Exposure
When an investor already has the full amount available, gradual investment temporarily leaves some money outside the chosen asset. If the asset rises, the uninvested money does not participate in those gains. This is the principal opportunity cost of spreading a lump sum over time. However, if markets decline, the delayed investments can purchase shares at lower prices. The outcome depends on the price path. No capital-deployment method dominates under every possible sequence of returns.
The Most Important Distinction: New Income Versus Existing Cash
Two investment situations are frequently grouped under the same dollar-cost averaging label. They should be evaluated separately.
Investing Money as It Becomes Available
Consider an employee who receives a monthly salary and invests $600 after meeting household expenses. The investor cannot necessarily invest the next twelve months of savings immediately because those future earnings have not yet been received. The contribution schedule reflects the timing of available income. In this situation, dollar-cost averaging can establish a disciplined saving and investment habit.
Deliberately Delaying a Lump Sum
Now consider an investor who already has $12,000 available for a long-term investment. The investor chooses to deploy $1,000 monthly for twelve months. This is a deliberate decision to postpone exposure to the selected assets. The remaining money stays in cash or another temporary holding. The investor may prefer this approach because of concerns about short-term losses or regret. However, delaying exposure creates an opportunity cost if the investment appreciates.
Why the Distinction Changes the Analysis
It is misleading to apply research about delayed lump-sum deployment directly to every retirement contribution made from future paychecks. An employee investing each paycheck is not necessarily making a decision to hold already available investment capital in cash. By contrast, an investor intentionally staging an existing lump sum is making a choice about when to accept market risk. The expected-return trade-off applies most directly to that second decision. FINRA’s May 2026 investor education makes this distinction explicit.

What Research Says About Dollar-Cost Averaging
Vanguard’s February 2023 study by Megan Finlay and Josef Zorn examined investing an available lump sum immediately versus staged deployment. Its historical global-equity illustration found lump sum ahead in 68% of rolling one-year comparisons using MSCI World returns for 1976–2022.
The staged strategy split capital into three equal purchases one month apart; uninvested money earned no interest in that illustration. These details matter: the finding is not a forecast, a universal success probability or a comparison with investing future paychecks. Results can differ with the market, allocation, deployment schedule, cash return and measurement period.
Earlier exposure can capture more of an investment’s positive expected return, while staging temporarily limits the amount exposed to an immediate decline. The paper also considers loss aversion: a defined schedule may help an investor who would otherwise avoid investing or abandon the plan. Behavioral usefulness does not establish a higher expected return.
Benefits of Dollar-Cost Averaging
Dollar-cost averaging offers several potential benefits. Their importance varies by investor.
Encourages Consistent Saving
A recurring investment schedule can connect long-term investing with an ordinary household budget. Rather than waiting until a large amount has accumulated, an investor can allocate a portion of available income regularly. The habit can support sustained wealth accumulation. However, contributions should remain affordable after essential expenses and appropriate liquidity needs are considered.
Reduces Repeated Timing Decisions
A predetermined investment schedule reduces the number of separate market-entry decisions. The investor does not need to decide whether the next week is likely to offer a lower price. The contribution occurs according to the plan. This can reduce dependence on short-term forecasting.
Purchases More Shares at Lower Prices
For fixed monetary contributions, falling prices increase the number of units purchased. This can reduce the average cost per share over a variable price path. However, it does not establish that the investment will recover or earn a profit.
Supports Behavioral Discipline
Market declines can produce fear. Market rallies can create urgency and fear of missing out. A scheduled investment process can reduce the influence of those emotions. The investor follows a rule rather than reacting automatically to every headline.
Makes Small Contributions Practical
Regular investing allows investors to build positions gradually using available savings. They do not need to accumulate a large initial amount before beginning. Whether this is practical depends on transaction costs, minimum purchase requirements and brokerage capabilities.
Can Reduce Initial Downside Exposure When Deploying a Lump Sum
If a lump sum is invested gradually, only part of the capital is exposed immediately. If the market declines during the deployment period, the uninvested portion avoids the corresponding market loss. This advantage is temporary. The uninvested capital may also miss gains. It should therefore be viewed as a trade-off rather than an unconditional benefit.
Risks and Limitations of Dollar-Cost Averaging
The strategy has genuine limitations. Understanding them prevents investors from confusing a consistent process with guaranteed financial success.
Market Risk Remains
Dollar-cost averaging does not stop the underlying investment from falling in value. A diversified equity ETF can experience a severe bear market. A concentrated fund may perform much worse. An individual company can suffer permanent impairment. The investment risk depends on the assets purchased.
No Guaranteed Profit
An average acquisition cost below the earlier market price does not establish a future return. Profit requires a sufficiently favorable later investment value, including distributions and costs.
Opportunity Cost
When money is already available, holding part of it in cash delays exposure to potential investment gains. This can reduce long-term returns when prices rise during the deployment period.
Potentially Higher Transaction Costs
Frequent purchases may generate repeated brokerage commissions, foreign-exchange charges or spreads. The economic effect depends on transaction size and brokerage pricing.
Strategy Drift
An investor may begin with a fixed schedule but abandon it during volatility. For example, the investor may stop contributions after a decline because the market feels dangerous, then increase purchases after a rally. The resulting behavior no longer follows the original DCA process.
Concentration Risk
Regular purchases into one company can gradually create an excessively concentrated portfolio. Automatic investing does not eliminate the need to monitor allocation.
Liquidity Risk
Investing money needed for near-term expenses can create forced-selling risk. A contribution schedule should not consume emergency reserves or capital required for essential obligations.
Inflation and Opportunity Costs of Cash
During staged deployment, uninvested money may lose purchasing power if inflation exceeds the after-tax return earned on the temporary cash balance. The magnitude depends on prevailing rates and inflation.
Neither historical correction duration nor bear-market recovery history sets a deadline for your investment to recover. The bear-market guide explains deeper drawdowns. Recurring purchases increase units; they do not remove those risks.
Dollar-Cost Averaging Does Not Repair a Bad Investment
One of the most consequential mistakes is assuming that buying more shares at lower prices must eventually generate a favorable result. Consider a company whose stock declines from $100 to $60. An investor purchases additional shares. The stock then falls to $30. The investor buys again. Later, the company faces bankruptcy, and the common shares become worthless. The investor acquired more shares at progressively lower prices. But that did not protect the invested capital.
Price Decline Versus Fundamental Deterioration
A stock may fall because its valuation multiple contracts even though the business remains financially strong. It may also fall because revenue, profitability, competitive position or financing capacity has deteriorated. These situations require different analysis.
Broad-Market ETFs Are Different From Individual Stocks
A diversified index ETF reduces dependence on one company. Its composition may change over time. Nevertheless, it remains exposed to market risk and can suffer prolonged losses. Diversification improves the distribution of certain risks; it does not ensure recovery by a particular date.
When to Reassess a Recurring Purchase
An investor should periodically confirm that the asset still serves the intended investment objective. For an ETF, this means reviewing the index or strategy, underlying holdings, concentration, expenses and risk. For an individual company, it may require examining earnings, debt, cash flows, capital allocation and competitive position. Consistency is valuable when the underlying strategy remains suitable. It should not become an excuse for ignoring material changes.
For an individual business, our guides to reading a stock, the P/E ratio and the PEG ratio explain why a falling price alone does not establish investment value.
Dollar-Cost Averaging and ETFs
ETFs are commonly used for recurring investment strategies because they can provide exposure to diversified portfolios through a single security. However, ETFs differ considerably in risk.
Broad-Market Equity ETFs
A broad-market index ETF may be suitable for a long-term accumulation strategy when its exposure matches the investor’s objectives and risk capacity. Regular contributions can increase the number of shares over time. But the portfolio remains exposed to equity-market drawdowns.
Sector ETFs
A sector ETF concentrates on a particular industry. Dollar-cost averaging into a sector fund does not eliminate the possibility that the entire sector experiences weak long-term performance.
Dividend ETFs
Dividend-focused funds may distribute cash that investors can reinvest. The value of the underlying shares can still decline. Investors should evaluate total return, portfolio quality and distribution sustainability.
Covered-Call ETFs
Covered-call ETFs use options strategies that may generate distributions. However, premium income does not guarantee principal protection. Some strategies limit upside during strong recoveries. A consistent purchase schedule does not eliminate these structural trade-offs.
Bond ETFs
Bond funds may also be purchased periodically. Their values respond to interest rates, credit conditions and portfolio duration. Lower prices can reflect rising yields, but those movements may also introduce different financial risks. The correct ETF selection depends on portfolio objectives rather than the convenience of recurring purchases.
Compare the actual mandates before automating purchases: SCHD, JEPI, JEPQ, SPYI and QQQI have different return engines and portfolio risks. Our ETF research guide organizes the documents, while the ETF versus stock comparison clarifies company-specific exposure.
Dollar-Cost Averaging With Whole Shares Only
Not every brokerage allows fractional ETF purchases. This can create practical complications for investors making fixed contributions. Suppose an investor contributes $200 monthly to purchase an ETF trading at $75 per share. If only whole shares are available, the investor can purchase two shares for $150. The remaining $50 stays as cash, ignoring fees.
Whole-Share Example With Cash Carried Forward
Assume no commissions, no cash interest and purchases of as many whole shares as the available cash permits. Each month adds $200; unused cash carries into the next month.
| Month | New contribution | Cash available before purchase | ETF price | Whole shares bought | Cash left |
|---|---|---|---|---|---|
| January | $200 | $200 | $75 | 2 | $50 |
| February | $200 | $250 | $90 | 2 | $70 |
| March | $200 | $270 | $110 | 2 | $50 |
Total contributions are $600. Purchases cost $550 and acquire six shares; $50 remains as cash. At the final $110 price, shares are worth $660 and shares plus cash total $710. The $110 gain is distinct from the $600 contributed. The average acquisition cost of the shares is $550 ÷ 6 = $91.67; do not include the uninvested $50 in that share-cost calculation.
Why Execution Details Matter
A whole-share restriction means an investor may not deploy exactly the planned contribution amount every month. The difference can become more pronounced when individual share prices are high relative to the regular contribution.
Practical Alternatives
Investors may accumulate available cash until enough exists to purchase another share. Some brokers offer fractional purchases for eligible investments. Mutual funds may provide different minimum investment and purchase arrangements. The appropriate solution depends on account rules, transaction costs and the investment objective. The presence of a whole-share restriction does not make recurring investing impossible, but it does require realistic calculations.
The whole-share ETF rebalancing guide develops the practical rounding calculations. Our ETF versus mutual fund guide compares trading and purchase arrangements across fund structures.
Transaction Fees and Currency Conversion
Small recurring investments can be sensitive to transaction costs. Suppose an investor sets a $100 total monthly budget and pays a $5 commission from that amount. Only $95 is invested each month. Over twelve months, $1,200 enters the account, $60 pays commissions and $1,140 purchases investments. The commission consumes 5% of each cash contribution. That is a substantial cost before accounting for spreads or fund expenses.
The Effect of Lower Commissions
If the broker charges no commission for eligible ETF purchases, the explicit trading commission disappears. However, investors may still face bid-ask spreads, currency conversion charges, account fees and other expenses. Zero commission does not necessarily mean zero total transaction cost.
Foreign-Currency Purchases
A Canadian investor purchasing U.S.-listed ETFs may need to convert Canadian dollars into U.S. dollars. Repeated currency conversions can create additional costs. If the broker allows the investor to retain U.S. dollars, the cost structure may differ. Investors should evaluate the actual brokerage terms before selecting an automatic contribution frequency.
Comparing Monthly and Quarterly Purchases
A monthly schedule offers more frequent investment exposure. A quarterly schedule may reduce repeated transaction costs in accounts with fixed commissions. However, waiting to accumulate funds can also delay market exposure. The appropriate balance depends on contribution size, available funds and trading expenses.
Our ETF creation and redemption guide separates the bid-ask spread, NAV and recurring fund expenses. The QQQ-to-QQQM switching analysis illustrates why a fee saving should be assessed alongside one-time transaction costs.
Choosing a Dollar-Cost Averaging Frequency
Dollar-cost averaging does not require daily investing. Common schedules include weekly, biweekly, monthly and quarterly contributions. The frequency should be practical and consistent with the investor’s financial situation.
Weekly Contributions
Weekly investing may align with income received on a weekly schedule. It also creates more transactions. Whether those transactions are economical depends on brokerage costs and available purchase features.
Biweekly Contributions
Biweekly investing can align with common payroll schedules. It allows investment contributions to follow the rhythm of income.
Monthly Contributions
Monthly investing is straightforward to coordinate with household budgets. It is often convenient for investors who review expenses and savings once each month.
Quarterly Contributions
Quarterly contributions may suit individuals with variable income or fixed transaction fees. However, capital may remain uninvested for longer periods.
Is More Frequent Investing Always Better?
No. The value of additional frequency depends on available capital, costs, and price changes. An investor receiving income monthly generally does not need to divide every contribution into numerous separate transactions to benefit from a regular investment discipline. The objective is consistency and suitability, not maximum transaction count.
Dollar-Cost Averaging During Market Corrections
Market corrections can test investor discipline. A portfolio may decline 10%, then 15%, while financial commentary becomes increasingly pessimistic. An investor using a recurring contribution strategy may continue purchasing according to the plan. This can increase accumulated shares at lower prices. However, the strategy must remain financially appropriate.
Why Lower Prices Can Help Accumulation
Suppose an ETF falls from $100 to $80. A $400 contribution previously purchased four shares. At $80, it purchases five shares. If the ETF eventually appreciates, the additional shares participate in future gains.
The Risk of Further Declines
The price may continue falling after the purchase. An investor buying at $80 may experience a loss if the ETF subsequently declines to $60. The fact that shares were cheaper than their previous high does not establish the final market low.
Avoid Automatically Increasing Contributions
Some investors increase purchases sharply during corrections. This may be appropriate when they have additional capital intended for long-term investment and the change remains consistent with portfolio risk limits. But deploying emergency reserves or borrowing heavily to buy a decline creates additional risks. A disciplined plan should account for liquidity, concentration and downside capacity.
Use the market-correction pillar for definitions and the correction versus bear-market comparison for severity. Our guides to what to do during a correction and buying during a correction connect purchase decisions with liquidity and investment risk.
Dollar-Cost Averaging and Compound Growth
Recurring contributions can support long-term wealth accumulation because they increase invested principal over time. Future investment returns may then apply to earlier contributions and any reinvested earnings. However, the result depends on actual market performance.
A Hypothetical Monthly Contribution Model
Suppose an investor contributes $500 at the end of every month for twenty years. Assume a constant hypothetical nominal annual return of 7%, converted into an effective monthly rate. The effective monthly rate is:
This equals approximately 0.5654% per month. The future value of end-of-month contributions can be estimated using:
Where: C is the monthly contribution. r is the effective monthly return. n is the total number of contributions. For 240 contributions of $500, the future value is approximately $253,768.19, calculated using the full-precision effective monthly rate. The hypothetical growth above $120,000 of contributions is $133,768.19. The investor contributes $120,000 in principal. The remainder represents hypothetical investment growth.
Assumptions Matter
This calculation assumes smooth, constant compound growth. Actual stock-market returns fluctuate. An investor may experience several negative years, prolonged periods of weak performance or returns substantially different from the assumption. The projection also excludes taxes, fees and inflation. A planning model should make these limitations visible.
Inflation-Adjusted Growth
If inflation averages 3% annually over twenty years, the future nominal balance will have less purchasing power than the same amount today. The nominal ending value of $253,768.19 would represent: $253,768.19 ÷ 1.03^20 ≈ $140,505.29 in today’s purchasing power. The example demonstrates why long-term investment goals should be evaluated in both nominal and real terms.
The accumulation formula uses a constant effective annual total return, including reinvested income. Do not add a dividend yield on top of that assumption. Our compound-interest guide explains the growth relationship; inflation and investing explains why nominal account growth and purchasing-power growth differ.

Dollar-Cost Averaging and Dividend Reinvestment
Dividend reinvestment and dollar-cost averaging are related but distinct. Dollar-cost averaging involves scheduled purchases using committed capital. Dividend reinvestment involves using cash distributions from existing investments to acquire additional shares. An investor can use both strategies simultaneously.
How the Processes Interact
Suppose an investor contributes $400 monthly to an ETF. The ETF also pays periodic cash distributions. If those distributions are reinvested, the investor accumulates shares through two sources: New savings contributions and reinvested cash distributions. The resulting share balance depends on contribution amounts, distributions, purchase prices and the reinvestment mechanism.
DRIP Restrictions
Some brokerage accounts permit automatic dividend reinvestment. Others require manual purchases. Some support fractional shares; others permit only whole shares. The treatment of residual cash differs by brokerage and security.
Dividend Reinvestment Does Not Guarantee Higher Total Return
A reinvested dividend increases the number of shares held. However, the distribution is not an additional economic gain separate from the investment’s total return. Dividend payments generally reduce the fund’s net assets by the amount distributed, all else equal. Reinvestment changes how the investor maintains exposure to the investment. It does not create guaranteed profits.
Read dividend yield versus total return and dividend yield explained before treating distributions as additional profit. The covered-call ETF financial-report guide helps distinguish distributions, operations and changes in net assets.
Dollar-Cost Averaging and Portfolio Rebalancing
An investor may contribute regularly to several asset classes. For example, the target portfolio allocation might be 60% equities and 40% bonds. Market price changes can cause the actual allocation to drift away from those weights. New contributions can help restore the target.
A Rebalancing Example
Suppose a portfolio has a current value of $90,000, consisting of: $50,000 in equities and $40,000 in bonds. The current equity allocation is approximately 55.56%. The target remains 60%. If the investor contributes $1,000 of new capital, directing that contribution toward equities raises the equity position to $51,000. The new portfolio total becomes $91,000. The equity allocation increases to approximately 56.04%. It moves closer to the target but does not fully restore it.
Why Contribution-Based Rebalancing Can Help
Using new contributions to purchase underweight assets may reduce the need to sell existing holdings. That can help manage transaction costs and potential tax consequences. However, small contributions may be insufficient to correct large allocation imbalances quickly.
When Traditional Rebalancing May Still Be Needed
An investor may need to consider additional transactions when allocation drift becomes substantial. The decision depends on the portfolio, tax treatment, costs and predetermined rebalancing policy. Dollar-cost averaging and rebalancing complement each other, but they solve different problems. One addresses the timing of contributions. The other addresses portfolio risk allocation.
Our portfolio-construction guide establishes allocation targets. The portfolio-maintenance workbook supports subsequent review, and VOO and VTI overlap shows why buying several funds can duplicate exposure. VOO versus QQQ compares materially different equity exposures.
Dollar-Cost Averaging for Retirement Accounts
Recurring investment contributions are common in retirement savings plans. Employer-sponsored plans, individual retirement accounts and other investment arrangements may support regular funding. However, contribution limits, eligibility rules and tax treatment depend on jurisdiction and account type.
U.S. Retirement Plans
Participants in eligible employer-sponsored retirement plans may contribute from each paycheck. Those contributions can be invested according to the plan’s available investment options.
Canadian Registered Accounts
Canadian investors may make recurring contributions to eligible RRSPs, TFSAs and other accounts, subject to applicable rules and contribution room. The investment purchases inside the account depend on the broker and account restrictions.
Contributions Are Not the Same as Investment Returns
Tax advantages may improve the overall financial treatment of a retirement savings strategy. However, they do not eliminate the risk of losses in the underlying investments. An investor should distinguish the benefits of the account structure from the investment strategy used within it.
Regular Contributions and Income Changes
Contribution amounts may need to change when household income or expenses change. Maintaining financial stability can be more important than rigidly preserving a fixed contribution during an emergency. A recurring strategy should support long-term goals without jeopardizing essential obligations.
Should Investors Stop Dollar-Cost Averaging During a Recession?
There is no universally correct answer. A recession may affect asset prices, employment income, business conditions and household liquidity. An investor with stable income, adequate reserves and a suitable long-term allocation may be able to maintain scheduled contributions. An investor facing job loss, unexpected expenses or severe debt pressure may need to reduce or temporarily suspend investing. The correct decision depends on financial circumstances.
Separate Portfolio Risk From Household Risk
An equity-market decline may be financially manageable for an investor with a long horizon. The same decline can become more difficult if household income also disappears. A financial plan should therefore consider employment and liquidity risks alongside market returns.
Avoid Treating Contributions as an Obligation at Any Cost
An investment schedule is a tool. It should not override the need to meet essential expenses, maintain appropriate insurance or manage expensive debt.
Avoid Selling Based Only on Headlines
Stopping purchases because financial commentary has become pessimistic may undermine a strategy that was designed for long-term accumulation. However, maintaining unsuitable exposure merely to demonstrate discipline is also inappropriate. The relevant question is whether the financial plan remains sound.
The economic-recession pillar separates business-cycle conditions from market-price labels. A household facing reduced income may need to change its contribution plan even when its long-term portfolio allocation remains sensible.
Dollar-Cost Averaging and Behavioral Finance
Investment decisions are influenced by more than calculations. Fear, optimism, regret and recent market performance can affect behavior. Dollar-cost averaging can reduce some of the demands placed on investor judgment. But it does not remove emotions entirely.
Loss Aversion
Investors may experience losses as more psychologically significant than equivalent gains. A substantial decline immediately after investing a large lump sum can create regret. Gradual investment may reduce the amount exposed at the beginning. However, it does not eliminate eventual market risk.
Recency Bias
Recent price movements can influence expectations. After markets rise, investors may believe gains will continue. After markets fall, they may anticipate further declines. A fixed contribution schedule avoids making every purchase depend on these short-term expectations.
Regret Aversion
An investor may delay investment because of concern about purchasing immediately before a downturn. A staged approach can make the initial decision more manageable. However, postponing investment can also create regret if markets rise sharply.
The Risk of Over-Automation
An automated schedule reduces repeated decisions, but it should not eliminate periodic investment review. Investors should still evaluate asset allocation, suitability, costs and changes in financial circumstances. A useful process combines consistent implementation with thoughtful oversight.
Use market warning signs to understand vulnerability rather than to justify a fresh forecast before each purchase. Our historical correction examples, correction-frequency research and S&P 500 correction statistics provide context without promising a particular next outcome.
When Dollar-Cost Averaging May Be Appropriate
Dollar-cost averaging can be practical in several situations. It may suit an investor making regular contributions from employment income. It may help someone establish a repeatable long-term saving habit. It may be useful for an investor who prefers a structured process rather than repeated market-timing decisions. A short, predetermined staged-investment period may also help someone with an available lump sum who would otherwise avoid investing because of substantial loss aversion. However, even in those circumstances, the underlying investments must be suitable.
The contribution schedule does not determine the appropriate asset allocation.
When a Different Approach May Be Better
Immediate investment may offer an expected-return advantage when capital is already available, intended for long-term investment and the selected allocation is appropriate. An investor who needs capital soon may require lower-risk holdings rather than either immediate or staged equity purchases. Someone with insufficient emergency savings may need to strengthen liquidity before investing aggressively. An investor with substantial expensive debt may need to evaluate debt repayment against investment risk. The appropriate financial decision is broader than choosing between one purchase and several purchases.
A Practical Dollar-Cost Averaging Framework
A well-designed recurring investment process should begin with the financial objective.
Establish the Investment Goal
Identify whether the capital is intended for retirement, long-term wealth accumulation, education or another purpose. The objective influences the appropriate time horizon and risk exposure.
Determine an Affordable Contribution
Review income, essential expenses, debt payments and emergency reserves. Choose an amount that can be maintained without creating financial pressure.
Select Appropriate Investments
Evaluate diversification, fund strategy, expenses, concentration and investment risks. Avoid choosing a security only because its recent price has declined.
Choose a Practical Schedule
Align contributions with income availability and brokerage costs. Weekly, biweekly and monthly schedules can all be reasonable.
Understand Purchase Restrictions
Confirm whether fractional shares are supported and how unspent cash is handled.
Review Transaction Costs
Consider commissions, bid-ask spreads, currency conversion and recurring fund expenses.
Monitor Allocation
Ensure regular purchases do not create unintended concentration.
Review Without Attempting Constant Market Timing
A scheduled process does not require reacting to every daily market move. However, periodic reviews can identify changes in financial circumstances or investment suitability.
Common Dollar-Cost Averaging Mistakes
Believing the Strategy Guarantees Profits
It does not. The underlying investment can lose value.
Assuming a Lower Average Cost Means a Positive Return
A position may have a lower average acquisition cost than earlier prices while still trading below the investor’s actual cost.
Averaging Down Into a Deteriorating Company
Buying more shares of a financially distressed business can increase permanent-loss exposure.
Using Emergency Reserves
Essential cash should not automatically be committed to risky investments because prices have fallen.
Ignoring Opportunity Cost
Gradual deployment of an existing lump sum can underperform immediate investment when markets rise.
Paying Excessive Fees
Frequent small transactions can become inefficient when commissions or currency conversion costs are high.
Overconcentrating in One Fund or Sector
Regular contributions can amplify portfolio overlap if holdings are not reviewed.
Mistaking Dividend Reinvestment for Guaranteed Compounding
Reinvested distributions maintain investment exposure but do not ensure positive total returns.
Abandoning the Schedule During Every Downturn
Repeated discretionary interruptions can defeat the purpose of a predetermined contribution process.
Refusing to Reassess When Circumstances Change
Discipline should not mean ignoring serious liquidity problems or unsuitable investments.
Frequently Asked Questions
What Is Dollar-Cost Averaging in Simple Terms?
Dollar-cost averaging means investing a consistent amount at regular intervals regardless of market prices.
Does Dollar-Cost Averaging Guarantee a Profit?
No. Investment values can decline, and the strategy does not eliminate market risk.
Why Does DCA Buy More Shares at Lower Prices?
Because a fixed contribution is divided by the current share price. When the price declines, the same amount purchases more units.
What Is the Dollar-Cost Averaging Formula?
Shares purchased equal contribution amount divided by purchase price. Average acquisition cost equals total purchase cost divided by total shares acquired.
Is Dollar-Cost Averaging Better Than Lump-Sum Investing?
Not in every situation. Vanguard’s historical research found that immediate lump-sum investment outperformed common staged-investment approaches approximately two-thirds of the time.
Is Investing Every Paycheck the Same as Delaying a Lump Sum?
Both involve periodic purchases, but their economic situations differ. Investing new income does not necessarily involve deliberately holding already available capital in cash.
Should I Invest Weekly or Monthly?
The appropriate schedule depends on when money becomes available, transaction costs and personal financial management preferences.
Does Dollar-Cost Averaging Work During a Bear Market?
It can continue accumulating shares at lower prices, but the investment may experience substantial losses and recovery is not guaranteed.
Can Dollar-Cost Averaging Lose Money?
Yes. The portfolio can decline below the total contributions made.
Is DCA Suitable for ETFs?
It can be, provided the ETF’s exposure, costs and risk are appropriate for the investor.
Can I Use DCA With Dividend ETFs?
Yes. However, dividend payments do not eliminate market risk or guarantee total returns.
Does DCA Work With Covered-Call ETFs?
The purchase method can be applied to eligible covered-call ETFs, but it does not remove their downside exposure or upside limitations.
Does DCA Require Fractional Shares?
No. Whole-share purchases are possible, though unspent cash and contribution consistency require additional consideration.
Can I Automate Dollar-Cost Averaging?
Some brokerages and retirement plans support automated recurring purchases. Available features vary.
Should I Increase Contributions When Prices Fall?
Only if additional purchases remain compatible with financial objectives, liquidity and risk limits. A higher purchase amount is not required by conventional fixed-contribution DCA.
Should I Stop During a Recession?
The decision depends on income stability, emergency savings, financial obligations and portfolio suitability.
Is DCA a Way to Time the Market?
Conventional DCA reduces the need for repeated short-term entry forecasts. However, deliberately staging a lump sum remains a decision about the timing of market exposure.
How Does DCA Affect Taxes?
Tax effects depend on jurisdiction and account. Multiple purchases can create different acquisition costs or cost-basis adjustments requiring appropriate recordkeeping.
Does DCA Reduce Portfolio Volatility?
Staged deployment temporarily reduces the capital exposed to the chosen risky asset compared with immediate investment. Once fully invested, the underlying portfolio’s risk is not eliminated.
What Is the Biggest Advantage of DCA?
For many investors contributing from regular income, its main practical advantage is a consistent, repeatable investment process.
What Is Its Biggest Limitation?
It cannot guarantee investment success, and delaying available capital can reduce expected returns when markets appreciate.
A Consistent Process Still Needs Suitable Investments
Dollar-cost averaging makes the contribution decision repeatable. It does not determine which investments belong in the portfolio, how much risk a household can bear or when a future market recovery will occur. The central distinction is the source of the capital. Investing new savings when they arrive is different from deliberately keeping an available lump sum partly in cash. Both can follow a schedule, but only the latter necessarily delays an existing investment opportunity.
Use the method alongside affordable contributions, suitable diversification, cost awareness and periodic review. A lower purchase cost cannot rescue a business that fails, and a disciplined schedule should never override essential spending or a material change in financial circumstances.
Dollar-Cost Averaging Calculator: Purchases and Average Cost
Use the six-price calculator to reproduce the purchase ledger or test another hypothetical path. It separates cash contributed, shares acquired, average cost and the final gain or loss.
Dollar-Cost Averaging Calculator: Long-Term Contributions
Use the contribution calculator to separate new money from hypothetical growth. The annual return is effective, so the monthly rate is (1 + annual return)^(1/12) − 1 rather than annual return divided by twelve.
Explore the Earlier Academy Pillars
Connect recurring investments with the fourteen earlier pillars on market risk, economic conditions, purchasing power and ETF operations.
Continue Learning in the Invest & Compound Academy
Use these related guides to connect the purchase schedule with investment selection, costs and performance measurement.
Recurring contributions, compounding and portfolio strategy
Market Correction Pillar | Indexes and Markets | Portfolio Construction
Sources and Further Reading
Reference review: October 18, 2026. Vanguard is an investment manager and the author of the cited research; its study does not establish future probabilities. Historical comparisons and their specific assumptions are identified in the research section. All other purchase paths, contribution examples and calculator defaults are hypothetical. Calculations use full precision before display rounding. No live market data or guaranteed returns are presented.
- SEC Investor.gov: Dollar Cost Averaging — definition of regular equal-amount purchases.
- Vanguard Research: Cost Averaging — Invest Now or Temporarily Hold Your Cash? Megan Finlay and Josef Zorn, February 2023. Figure 2 and its methodology notes.
- FINRA: The Benefits and Limitations of Dollar-Cost Averaging, May 19, 2026. Paycheck contributions, behavioral considerations, opportunity costs and transaction fees.
- SEC Investor.gov: Asset Allocation — investment objectives, diversification and portfolio risk.
- SEC Investor.gov: Mutual Fund and ETF Fees and Expenses — ongoing costs and transaction costs.
This article provides general financial education, not personalized investment, financial, legal or tax advice or a recommendation to buy, sell or hold any security.
Dollar-cost averaging does not assure a profit, prevent losses or guarantee a lower acquisition cost than other purchase methods. Staging existing cash delays market exposure and can involve opportunity costs. Fractional-share support, trading costs, account eligibility and tax treatment depend on the broker, product, jurisdiction and investor.
Constant-return projections are mathematical scenarios. Actual returns fluctuate and may be negative; investments can suffer permanent losses. Fees, taxes, contributions, distributions, currency changes and inflation affect outcomes. Consider your financial circumstances, review current product documents and consult qualified professionals where appropriate.

