What Is an Economic Recession? Causes, Indicators and Risks
Understand the business cycle, recession indicators and historical U.S. contractions—and how economic weakness can affect earnings, credit, household income and investments.
An economic recession is a broad contraction in economic activity. It can affect employment, household income, business revenue, investment and credit availability. Falling stock prices may accompany it, but a market decline and an economic recession are different measurements.
Understanding the distinction helps investors read economic headlines without turning every disappointing report into a trading signal. This guide explains recession definitions, causes, indicators and historical U.S. examples, then connects them with earnings, bonds, ETFs and household financial resilience.
The focus is the U.S. economy and the NBER business-cycle chronology. Other countries may use different dating institutions or conventions. For the market-price classifications, use our market correction versus bear market guide and bear-market pillar.
What Is a Recession?
An economic recession involves a decline in activity that is substantial and widespread enough to represent a contraction across the economy. In the United States, the National Bureau of Economic Research’s Business Cycle Dating Committee maintains the widely accepted historical chronology. The NBER is a private, nonprofit research organization, not a government statistical agency.
Its framework considers depth, diffusion and duration together: how severe the weakness is, how widely it spreads and how long it persists. These dimensions do not create a rigid checklist requiring identical conditions in every downturn. An exceptionally deep and broad collapse can qualify despite being brief, as the 2020 episode demonstrated.
The committee identifies a peak and a subsequent trough retrospectively. Under its monthly convention, the peak month is the final expansion month; the recession begins in the following month and ends in the trough month. An expansion starts after the trough. Turning-point dates therefore should not be confused with the later dates on which the committee announces them.
Why two negative GDP quarters are not the full U.S. definition
Two consecutive quarters of declining real GDP are a familiar shorthand. They are not the exclusive NBER definition of an economic recession. The committee examines a broader set of monthly and quarterly measures. The 2001 recession illustrates why a contraction can be identified without satisfying that particular two-quarter sequence under the referenced historical account.
A recession does not require every company to lose sales, every household to lose income or stock prices to fall throughout the contraction. It also does not automatically mean a banking crisis has occurred. The classification describes aggregate economic activity; individual experiences differ.
The Business Cycle: Expansion, Peak, Contraction and Trough
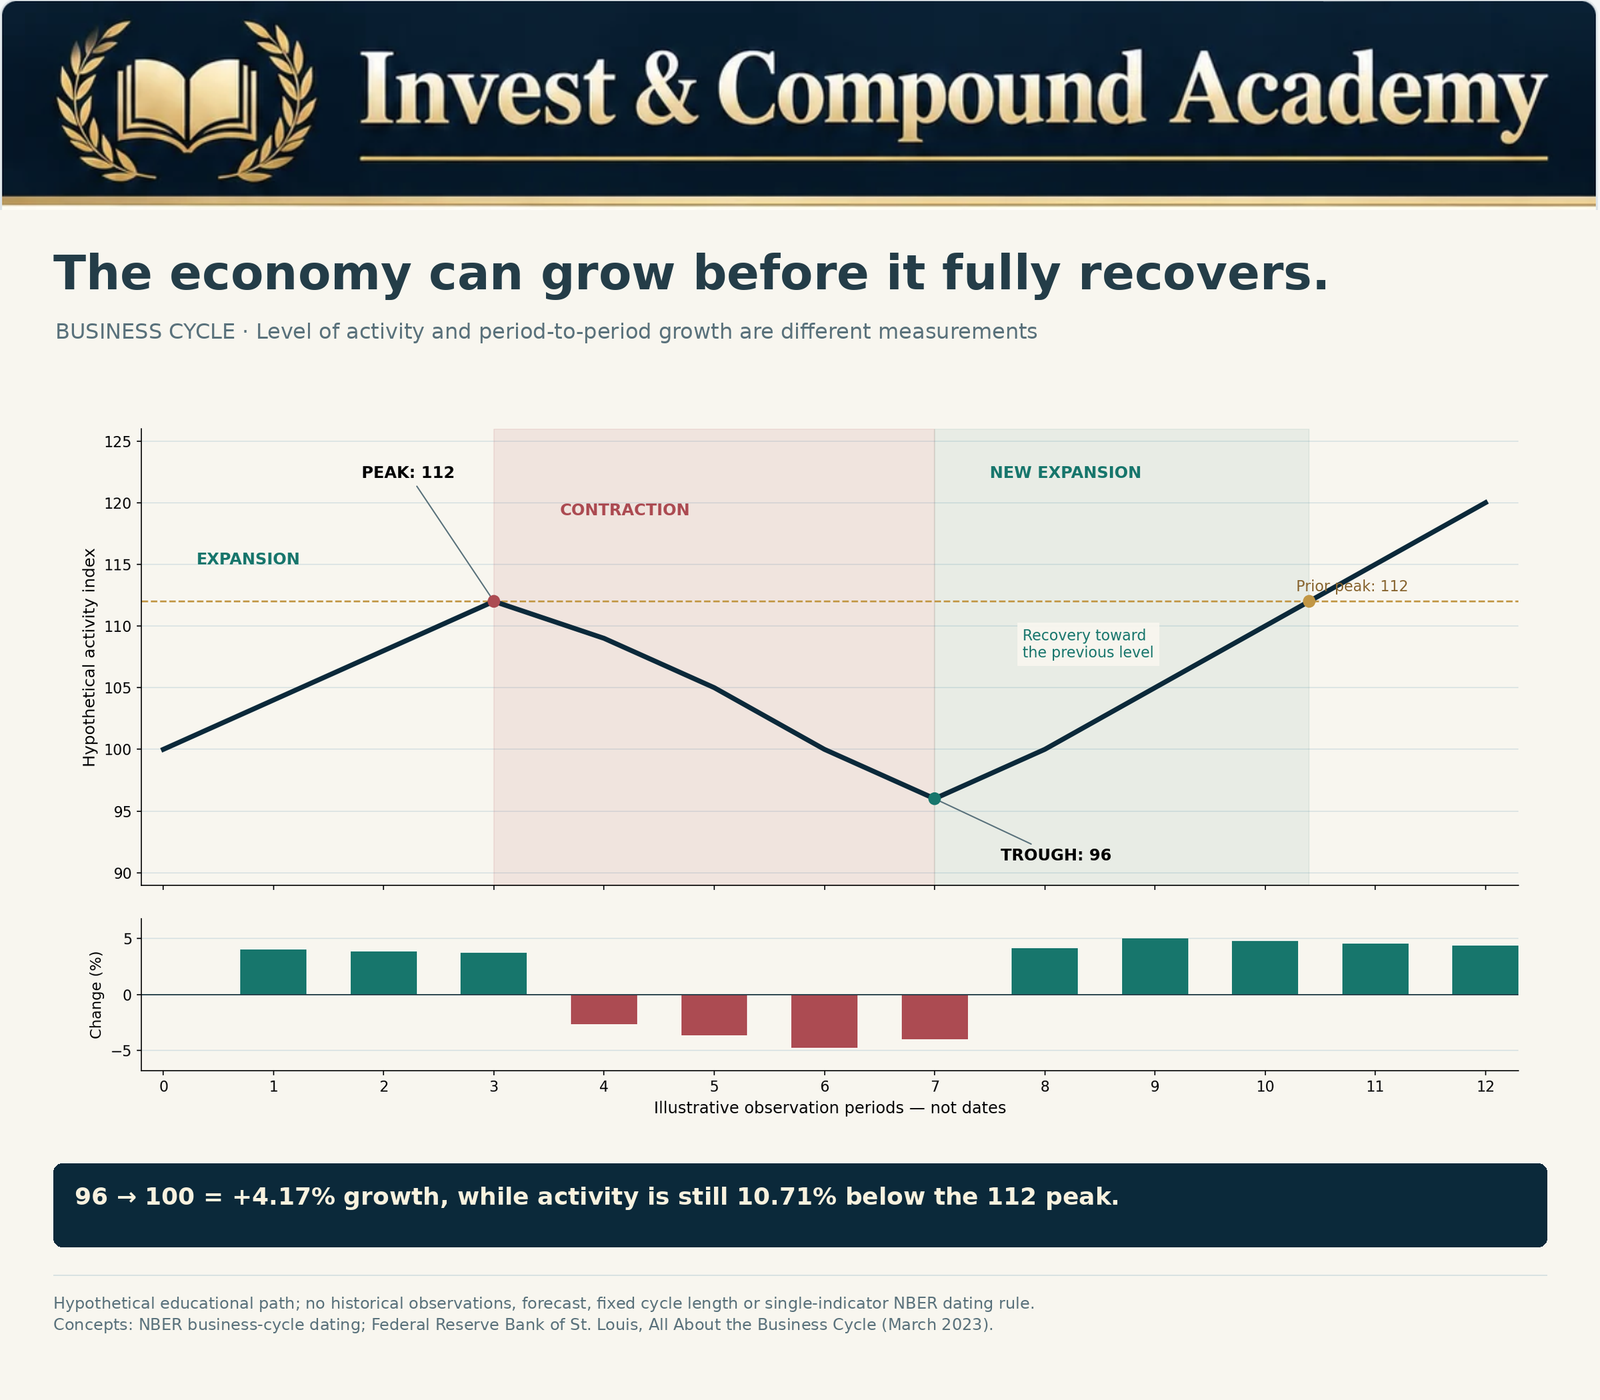
The business cycle describes changes in economic activity, not a predictable schedule. An expansion involves rising activity. A peak marks the turning point before a contraction; a trough marks the low point before a new expansion. Neither turning point must coincide with a stock-market peak or trough.
During an economic recession, firms may cut production, hiring and capital spending. After the trough, activity can start increasing while unemployment remains high and output remains below its former peak. The end of a recession therefore does not mean that households, employment and business profits have fully recovered.
Level of activity versus rate of change
The illustration uses a hypothetical activity index that peaks at 112, falls to 96 and then rises to 100. The rise from 96 to 100 is 4.17% growth, yet 100 remains 10.71% below 112. Positive growth and incomplete recovery can coexist.
Here, recovery means regaining a previous activity level. Expansion means activity is increasing after a trough. The graphic is a simplified teaching path, not historical GDP data or a single-indicator procedure for NBER dating. Real economic series can move unevenly rather than following a smooth curve.
What Causes an Economic Recession?
There is no universal starting shock. Monetary tightening, financial stress, supply disruptions, investment excesses and external events can contribute to an economic recession. The original shock and the mechanisms that amplify it should be examined separately.
Higher interest rates and restrictive monetary policy
Higher borrowing costs can discourage home purchases, consumer borrowing and business investment. A hypothetical project offering an 8% expected return looks different when financing costs move from 4% to 9%. That comparison illustrates a hurdle, not a complete valuation: financing mix, cash-flow timing and risk also matter.
Policy effects arrive with variable lags. Inflation can fall without a broad contraction, so rate increases do not mechanically guarantee an economic recession. Conversely, rate cuts may take time to help when borrowers are distressed or lenders remain cautious.
Credit contractions and financial crises
When lenders experience losses or become concerned about repayment, they may tighten standards. Households can find credit harder to obtain; companies can struggle to refinance debt or fund inventory. Weaker activity can then increase defaults and place further pressure on lenders.
Leverage can magnify the problem. An operating business may have a viable product but still face a funding crisis when debt matures. Fixed household payments can also become difficult to meet after an income disruption. Financial resilience depends on obligations and access to liquidity, not only on accounting profit.
Inflation and supply shocks
When prices rise faster than income, purchasing power weakens. Energy disruptions or shortages can raise costs while limiting production. Demand-driven inflation can also lead to policy tightening. Stagflation describes weak activity combined with elevated inflation, creating difficult policy trade-offs rather than a straightforward stimulus problem.
Asset bubbles and investment excesses
Optimistic forecasts can encourage overbuilding, excessive borrowing or investment in projects whose demand assumptions prove unrealistic. Falling asset values can weaken confidence and collateral. However, a speculative collapse does not automatically create an economic recession: the effects depend on leverage, financial-system exposure and the breadth of spending reductions.
External disruptions
Pandemics, conflicts, natural disasters, energy interruptions and trade restrictions can disrupt activity. Their effects differ by country and industry. Higher energy prices can pressure consumers and energy-intensive firms while benefiting some producers. Tariffs can protect some businesses while raising costs or reducing market access for others.
How Recession Pressures Spread Through the Economy
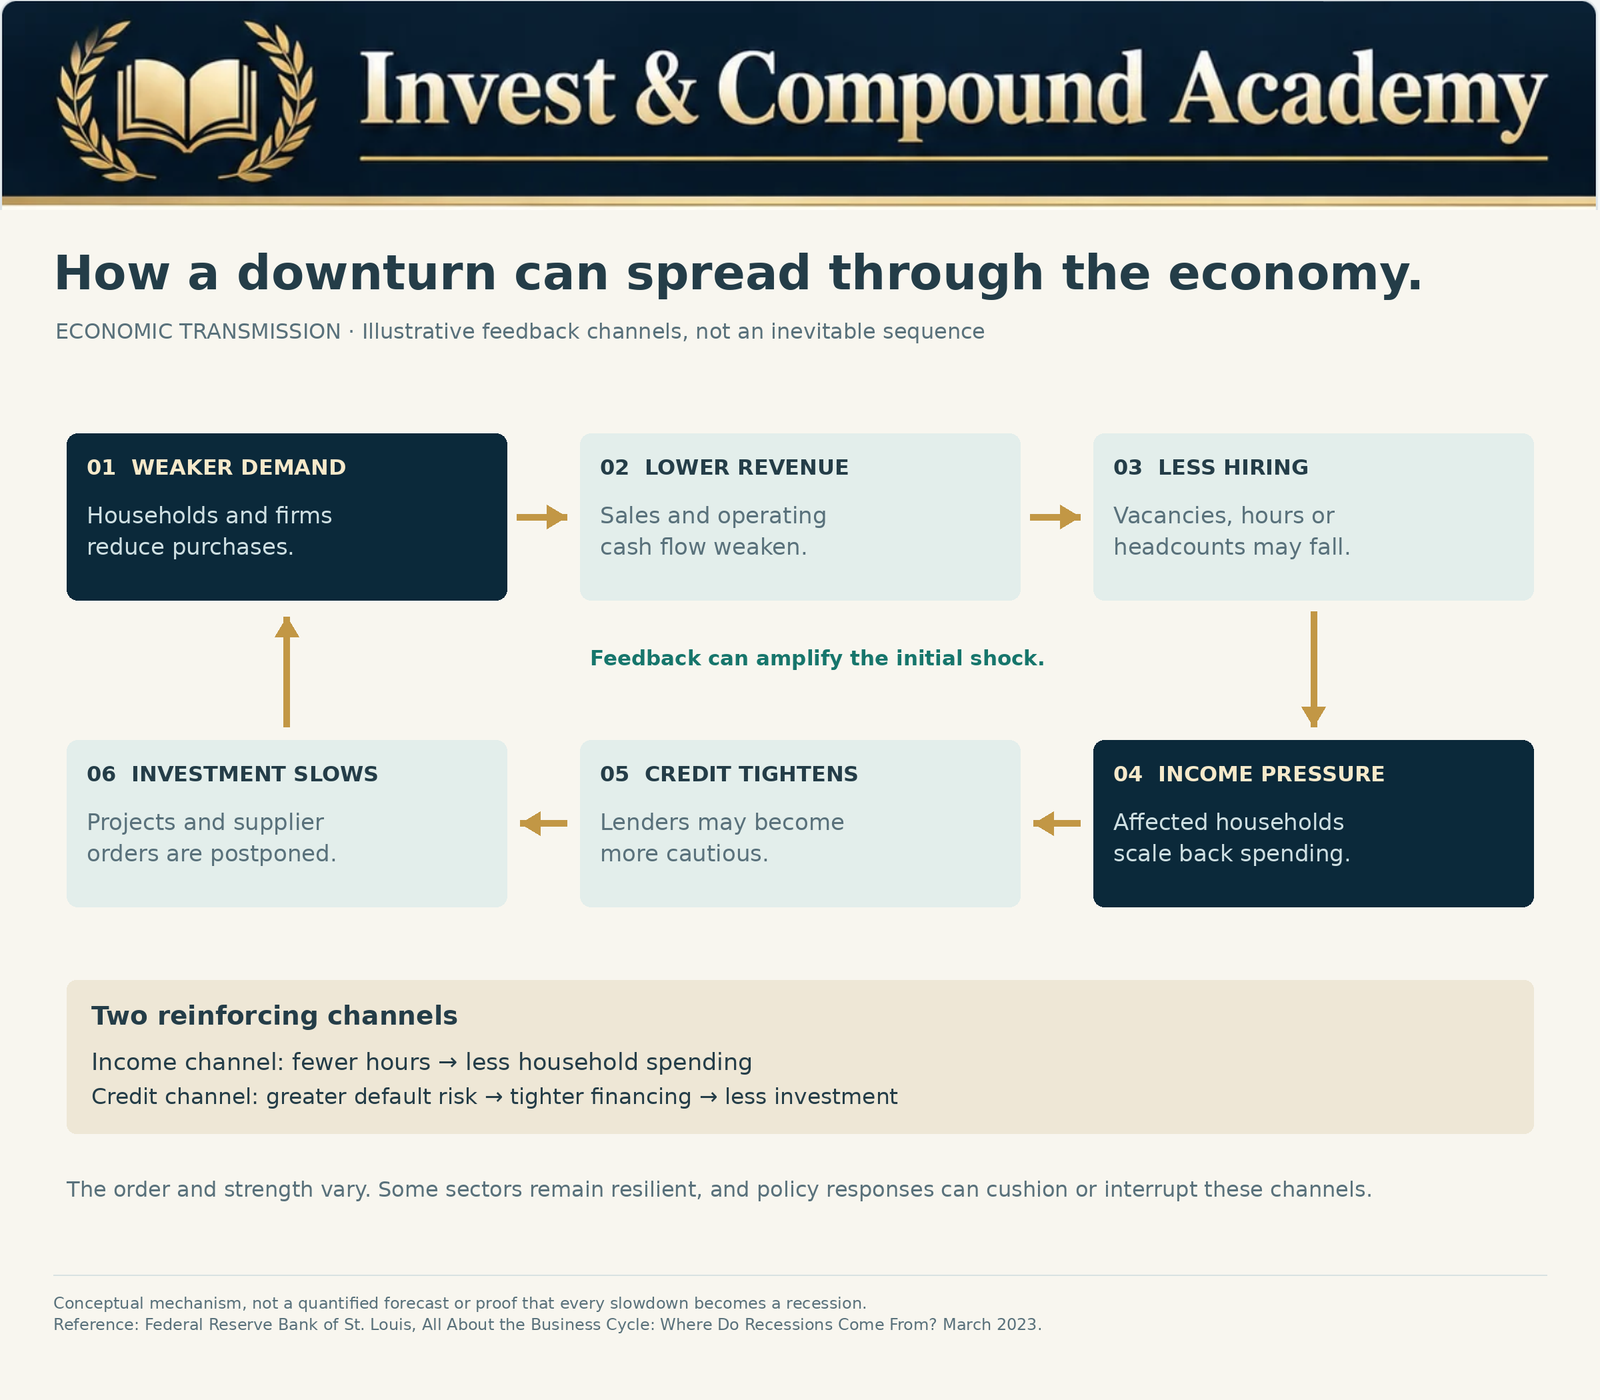
An economic recession can develop through reinforcing changes in demand, income and financing. Reduced purchases weaken revenue; some firms respond by cutting vacancies, hours or jobs. Affected households then have less income to spend, placing additional pressure on businesses.
Credit provides another channel. Rising default concerns can make lenders more cautious, delaying investment and supplier orders. These relationships can amplify a downturn, but they do not form an inevitable sequence. Some sectors remain resilient, and private adjustments or policy responses can interrupt the feedback.
This matters to investors because economic recession risk can affect a household’s income and investments at the same time. A portfolio loss is harder to manage if a job loss or weakening business cash flow also creates a need to withdraw money.
How Economists Identify an Economic Recession
No single release supplies a complete diagnosis. The NBER examines broad measures of real activity, including employment, income, spending, production and sales. Data revisions and the need to distinguish temporary noise from a sustained turning point help explain why announcements arrive retrospectively.
| Evidence | What it helps reveal | Interpretation issue |
|---|---|---|
| Real GDP | Inflation-adjusted production across the economy | Quarterly estimates can be revised |
| Payroll employment | Jobs across much of the economy | Revisions and sector differences matter |
| Household employment and unemployment | Labor-market conditions from a household survey | Participation and labor supply affect interpretation |
| Real personal income excluding transfers | Income generated outside government transfer payments | Inflation adjustment and temporary changes matter |
| Real consumer spending | Household purchases after price adjustment | Spending categories can move differently |
| Industrial production and real sales | Production and business activity | Manufacturing weakness alone is not an economy-wide verdict |
GDP growth units matter
Real GDP adjusts for price changes. In a hypothetical comparison, a rise from $25 trillion to $25.5 trillion is 2% period-over-period growth. A subsequent decline from $25.5 trillion to $25.25 trillion is approximately 0.98%.
Those calculations are not automatically annualized quarterly growth rates. U.S. BEA headline quarterly growth is generally expressed at an annual rate. For a quarterly change q, the compounded annualized equivalent is [(1 + q)^4 − 1] × 100. Compare the same units when evaluating an economic recession claim.
Employment, income and spending
Payrolls and household employment are distinct measures from different surveys. The unemployment rate measures unemployed people as a share of the labor force; it does not simply count everyone without a job. Weekly initial unemployment claims can provide timely information, but seasonal factors and unusual events can create noise.
Real income matters because nominal pay can increase while purchasing power falls. Consumer spending, industrial production and business sales add evidence about whether weakness is spreading. A broad assessment is more informative than treating one weak report as proof of an economic recession.
Leading, Coincident and Lagging Recession Indicators
Leading recession indicators may weaken before overall activity turns down. Examples can include certain yield-curve measures, new orders and forward-looking credit conditions. Coincident measures, such as employment, income and production, help describe current conditions. Lagging indicators may continue deteriorating after activity has begun improving.
These categories are useful descriptions, not fixed timing rules. An indicator can lead in one episode and behave differently in another. A labor-market statistic may be released promptly but still respond to business conditions with a delay. Confirm the reference period, release date and revision history before interpreting the signal.
Recession indicators provide evidence about the economy. They are not interchangeable with stock-market timing tools. Our market correction warning signs guide examines financial-market vulnerabilities, including earnings revisions, credit spreads and liquidity, without treating them as guaranteed forecasts.
The Sahm Rule: An Unemployment-Based Recession Indicator
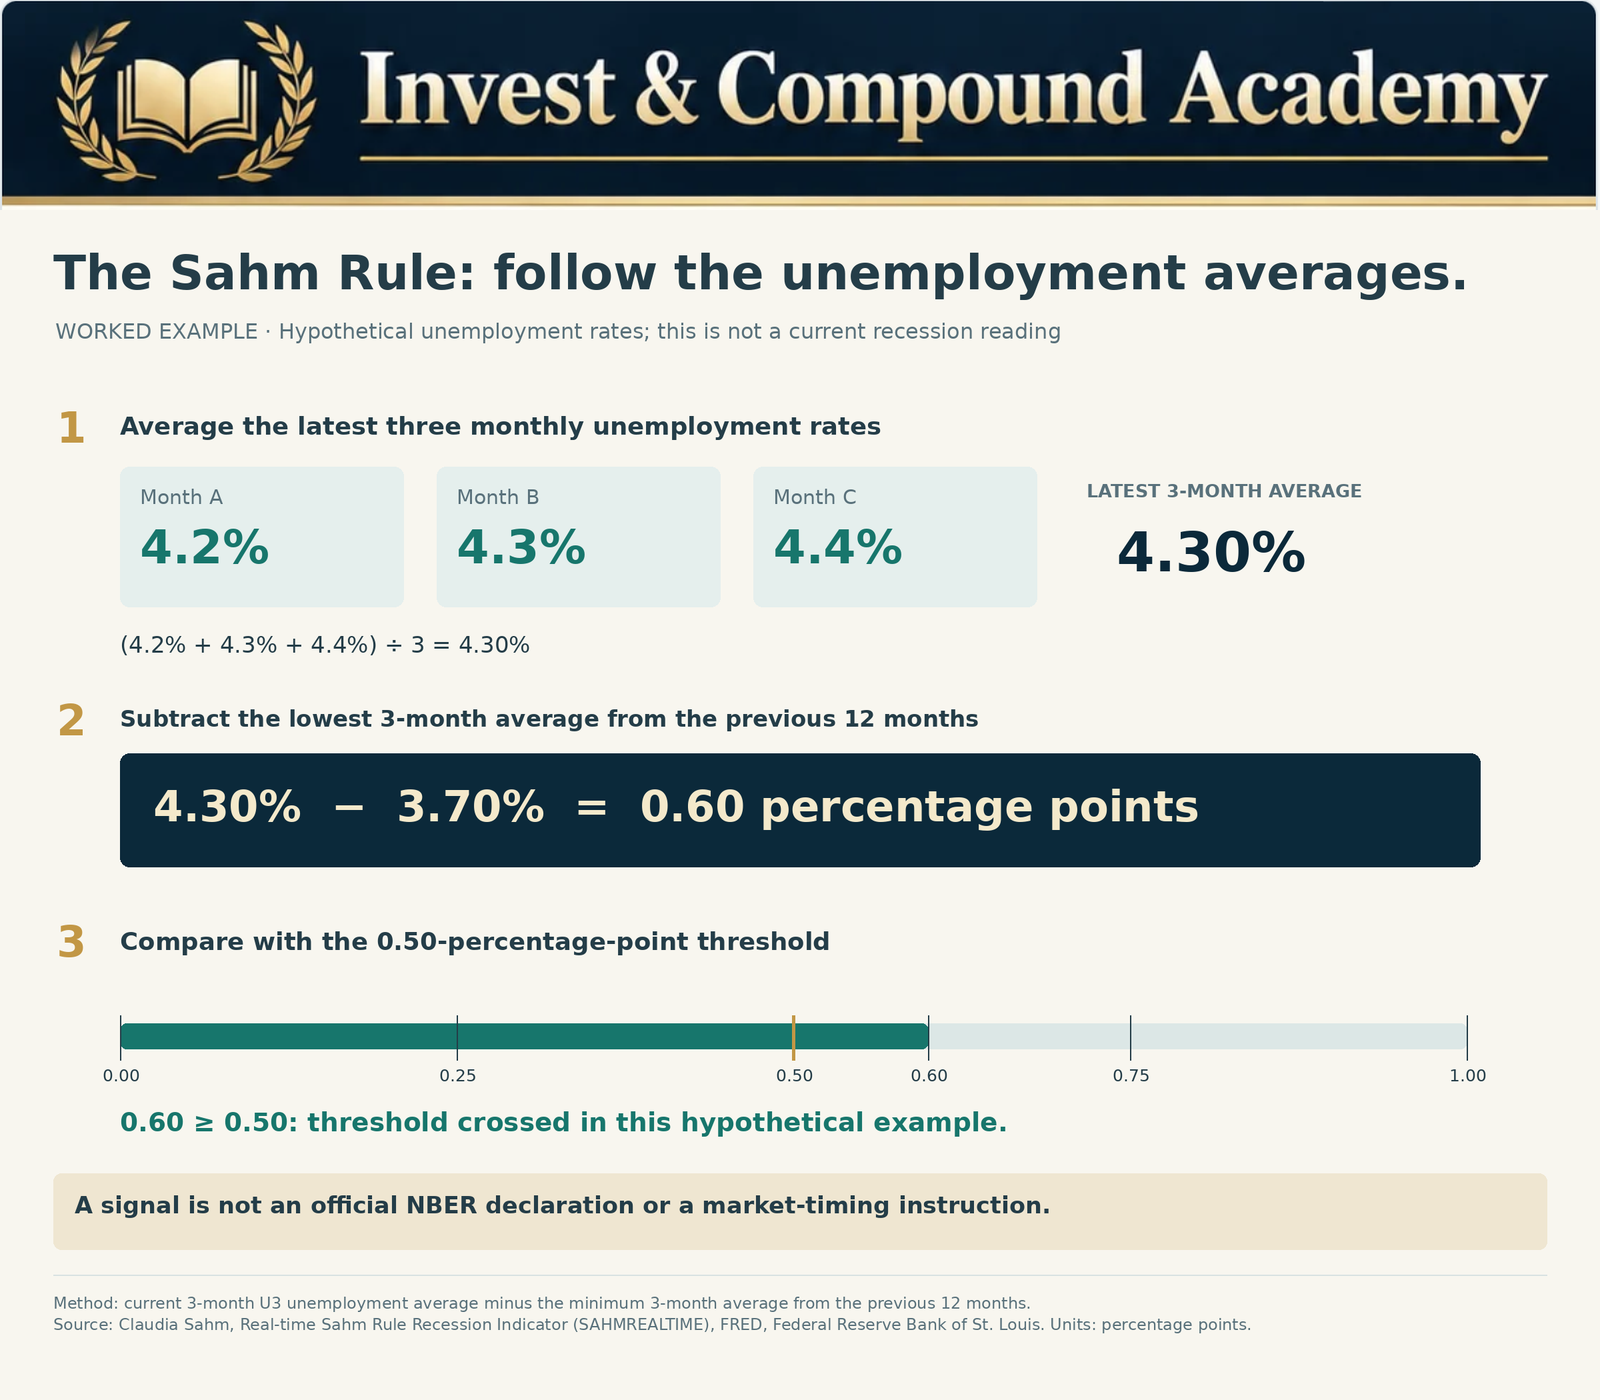
The Sahm Rule compares the latest three-month average of the U.S. U3 unemployment rate with the minimum three-month average from the previous twelve months. The conventional signal threshold is an increase of at least 0.50 percentage points.
In the hypothetical example, monthly rates of 4.2%, 4.3% and 4.4% average 4.30%. Subtracting a reference minimum of 3.70% gives 0.60 percentage points, above the threshold. This is a difference in percentage points, not a 0.60% relative increase.
The signal is not an official NBER economic recession declaration or an instruction to buy or sell investments. Labor supply, data revisions and unusual economic conditions can complicate interpretation. For a real-time analysis, use data available at that time; do not silently mix the real-time series with subsequently revised history.
The calculator below reproduces the arithmetic using a minimum that you supply. It does not retrieve twelve months of historical data, independently calculate that minimum or assess the current economy.
The Yield Curve and Economic Recession Risk
A yield curve compares interest rates across maturities. An inversion occurs when a selected longer-term yield falls below a selected shorter-term yield. There are multiple spreads, so a report should specify which maturities it uses.
Short-term rates reflect current and expected policy. Longer-term yields also incorporate expected future rates, inflation and term premiums. Expectations of eventual rate cuts can contribute to an inversion, but asset purchases, international demand and other influences can affect the curve too.
An inversion is not a countdown to an economic recession. Nor does a return to a positive spread automatically establish recovery. A curve can steepen because short-term yields fall or because long-term yields rise; those changes can reflect different economic circumstances. Forecasts need a stated horizon and assumptions.
Economic Slowdown, Recession and Bear Market
Growth falling from 4% to 2% means activity is increasing more slowly, not necessarily declining. That is a slowdown. An economic recession involves a sufficiently broad contraction. A soft landing generally describes an adjustment that eases inflation or other pressures without a major contraction; a hard landing describes more severe deterioration. Neither phrase has one universally accepted numerical threshold.
| Feature | Economic recession | Stock-market bear market |
|---|---|---|
| What is measured? | Broad economic activity | Financial asset prices |
| Classification | Multiple measures and business-cycle dating | Conventionally a decline of at least 20% from a reference peak |
| Main evidence | Income, employment, spending and production | Index or security prices |
| Must the other occur? | No fixed stock-price decline is required | A recession is not required |
| Timing | Economic turning points are identified retrospectively | Prices respond continuously to changing expectations |
Stock prices incorporate expectations about profits and discount rates. They can fall before an economic recession is recognized and recover while economic reports remain weak. The 1987 crash illustrates that severe market losses need not coincide with a U.S. recession.
For the price-based definitions, see what a market correction is and market corrections versus bear markets. Our historical market corrections guide examines selected episodes; correction duration and bear-market duration are separate questions from recession length.
Historical U.S. Economic Recessions
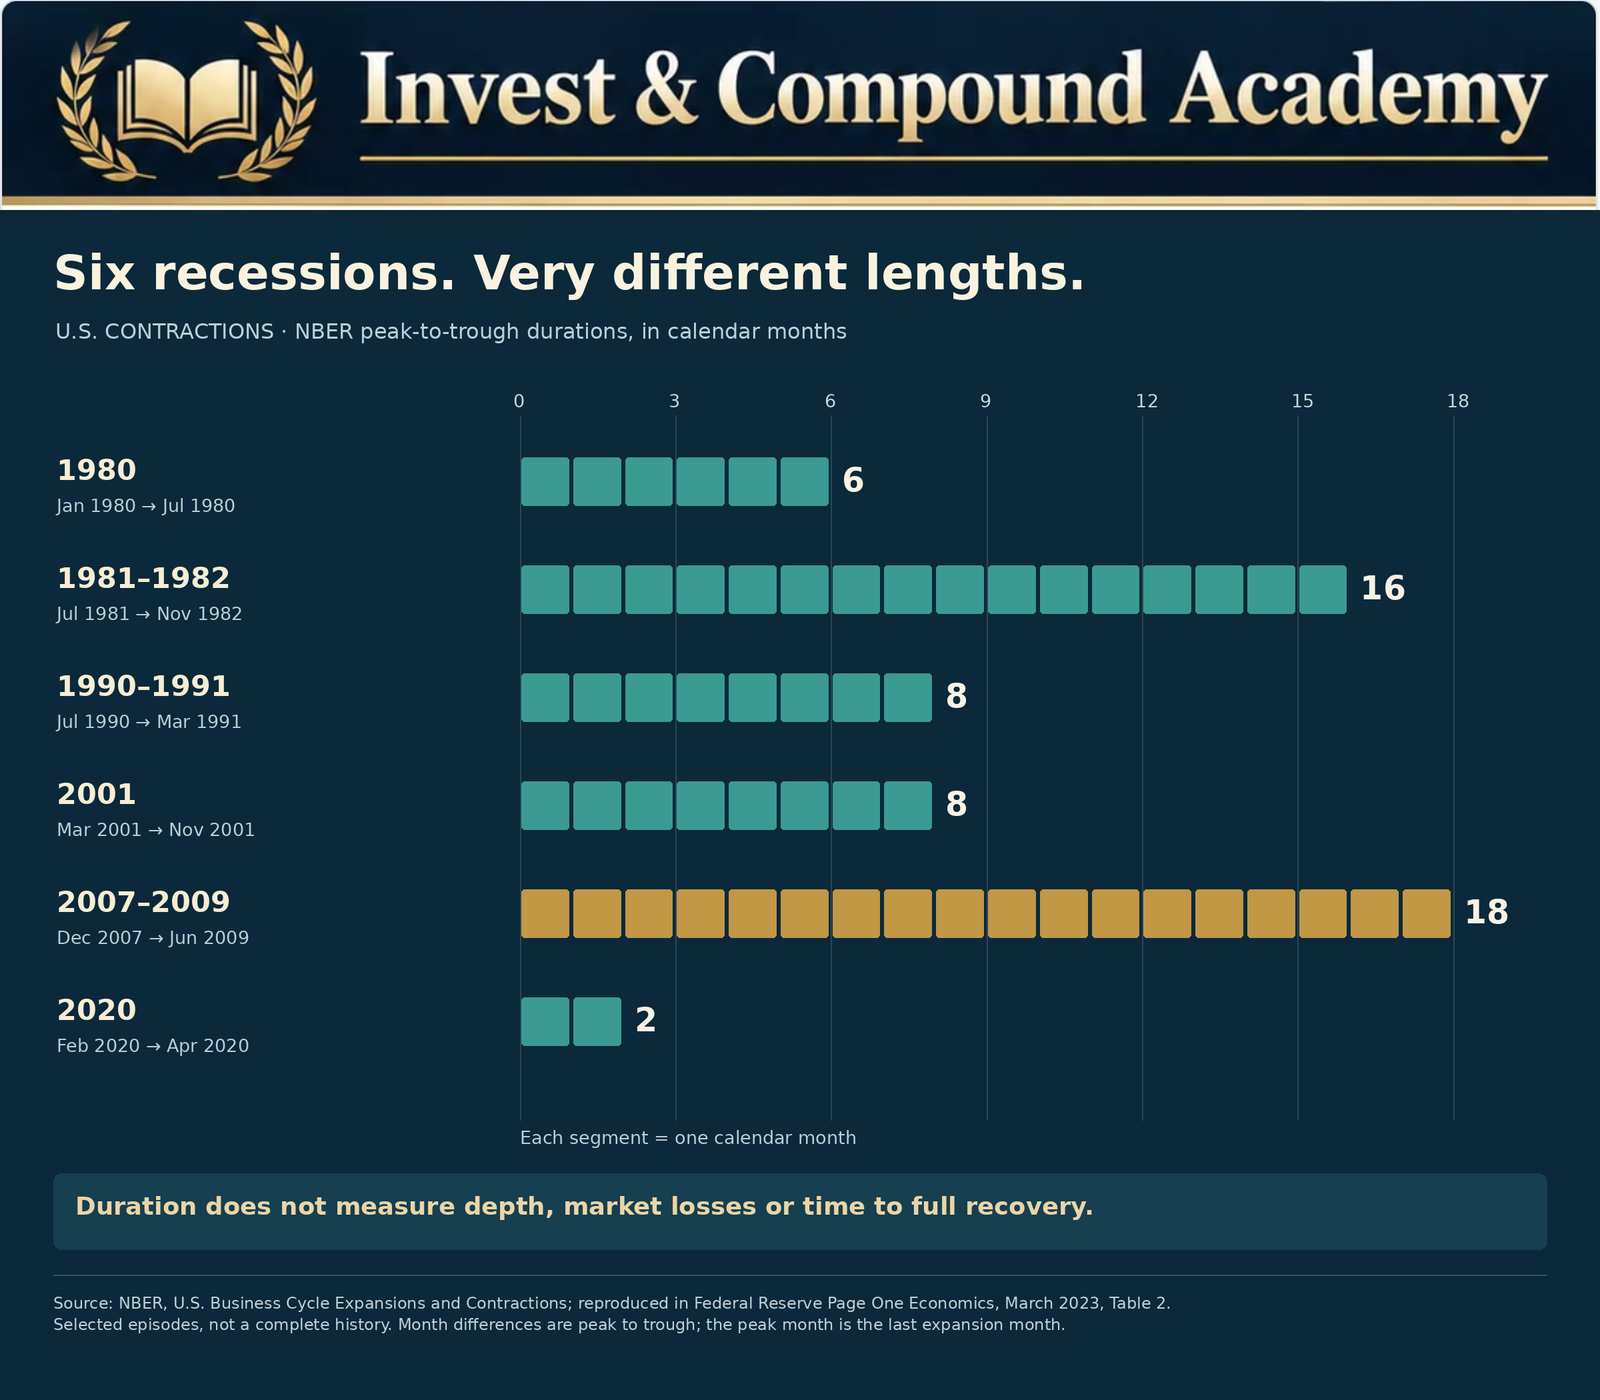
The NBER chronology shows substantial variation. The table gives economic peaks, troughs and the month difference between them. It does not measure the associated stock-market decline, its recovery or the time needed for every economic indicator to regain its previous high.
| Episode | Economic peak | Economic trough | Contraction |
|---|---|---|---|
| 1973–1975 | November 1973 | March 1975 | 16 months |
| 1980 | January 1980 | July 1980 | 6 months |
| 1981–1982 | July 1981 | November 1982 | 16 months |
| 1990–1991 | July 1990 | March 1991 | 8 months |
| 2001 | March 2001 | November 2001 | 8 months |
| 2007–2009 | December 2007 | June 2009 | 18 months |
| 2020 | February 2020 | April 2020 | 2 months |
The chart displays the six selected episodes from 1980 onward. Under the monthly convention, a February 2020 peak means the contraction began in March and ended in April. The peak-to-trough difference is two months, not an inclusive count of three named months.
2001: investment and technology weakness
Following substantial technology and telecommunications investment, weaker expectations and spending affected business activity. The peak was March 2001 and the trough November 2001. The episode highlights why one GDP shorthand cannot replace the wider dating framework.
2007–2009: financial-system stress
Housing-related credit problems, banking losses and deteriorating financing conditions reinforced economic weakness. The 18-month contraction demonstrates why balance sheets and refinancing access matter alongside a company’s long-term business prospects. Excess leverage can turn a revenue problem into a funding crisis.
2020: an exceptionally short, deep contraction
The pandemic disrupted employment, production and services abruptly. Its breadth and severity explain how the episode qualified despite lasting only two months under the NBER chronology. The economic recession ending did not mean every household, industry or job had recovered.
These are different mechanisms, not interchangeable templates. Historical averages cannot set the length of the next economic recession. For the statistical distinction between frequency, severity and duration, compare our S&P 500 correction statistics guide and correction frequency research.
Corporate Earnings and Sector Exposure
An economic recession can pressure revenue, margins and financing. Businesses with high fixed costs may experience a disproportionately large drop in operating profit when sales weaken. Other firms can adjust expenses more readily. Debt maturities and access to funding add risks that revenue trends alone do not reveal.
Share prices can react to expected earnings revisions before reported results deteriorate. Our stock research guide and P/E ratio explanation connect company fundamentals with valuation. A cheaper share price is not necessarily a cheaper claim on sustainable future earnings.
| Sector or business type | Potential economic recession sensitivity |
|---|---|
| Consumer discretionary | Purchases such as travel, vehicles or discretionary retail can be postponed |
| Consumer staples | Essential demand may be steadier, while costs, competition and valuation remain risks |
| Financials | Loan losses, funding costs, demand and interest margins can change together |
| Industrials | Business investment, transportation and global trade can weaken |
| Technology | Recurring essential services differ from discretionary projects or distant expected profits |
| Utilities and health care | Demand may be relatively stable, but financing, regulation and valuation still matter |
The word defensive does not mean risk-free. Company-specific finances and purchase valuation can dominate a broad sector label.
Bonds and ETFs During an Economic Recession
High-quality government bonds may benefit from falling yields or demand for relatively secure assets. They can also decline if inflation, term premiums or other factors lift yields. An economic recession does not guarantee that all interest rates fall.
Corporate credit adds a separate influence. Investment-grade spreads can widen, offsetting gains from lower government yields. High-yield issuers face greater default risk, and their bonds can suffer substantial losses. Duration measures price sensitivity to yield changes under specified assumptions; credit quality concerns a different source of risk.
ETF structure does not determine recession resilience
A fund’s holdings and strategy determine its exposures. A broad equity ETF still carries market risk; a sector ETF can be highly concentrated. Dividend funds can lose value and distributions may be cut. Covered-call funds retain downside exposure and can give up part of a rebound. Bond ETFs require separate analysis of duration, credit and liquidity.
Start with how the S&P 500 works and the VOO versus QQQ comparison to understand different equity exposures. The VOO and VTI overlap guide shows why owning several funds may not add as much diversification as expected.
For income strategies, compare SCHD explained, SPYI explained and dividend yield versus total return. The covered-call financial reports guide helps distinguish cash distributions from investment results. Our ETF research guide provides a broader review framework.
Household Income, Liquidity and Investment Decisions
Economic recession preparation should consider employment and business income as well as portfolio prices. Accessible reserves can reduce the need to sell investments during unfavorable conditions. The appropriate amount depends on essential spending, income stability, dependents and foreseeable obligations; no single number fits every household.
Mortgage and loan payments can remain due after income falls. Business owners may also face delayed receivables, weaker customer demand and inventory-financing needs. Reviewing those commitments before borrowing to invest is more useful than assuming that a diversified portfolio removes liquidity risk.
Are recessions good times to buy stocks?
Lower prices can improve prospective valuations, but an economic recession does not make every investment a bargain. A stock falling from $100 to $70 is 30% cheaper per share; its economic value may also have deteriorated if future earnings or financing prospects weaken.
Markets can rebound before reassuring data arrive. Waiting for an official recession announcement does not establish a precise entry point, while buying early does not prevent further losses. Review the worked comparisons in buying stocks during a market correction rather than treating the economic label as a buy signal.
Compound Growth, Withdrawals and Recovery Hurdles
A $100,000 portfolio losing 30% falls to $70,000. Returning to $100,000 requires a 42.86% gain, not 30%. The same loss arithmetic applies whether the decline occurs during an economic recession or under other market conditions.
| Investment decline | Remaining value of $100,000 | Gain needed to recover |
|---|---|---|
| 10% | $90,000 | 11.11% |
| 20% | $80,000 | 25.00% |
| 30% | $70,000 | 42.86% |
| 40% | $60,000 | 66.67% |
| 50% | $50,000 | 100.00% |
These examples exclude additional cash flows, fees, taxes and separate distributions. A household losing income may also reduce contributions or withdraw money, changing the capital available for a rebound. The compounding guide explains the changing base; measuring investment growth separates market results from deposits and spending.
Retirement withdrawals need separate treatment
Suppose $500,000 falls 25% to $375,000, followed by one $25,000 withdrawal. The remaining $350,000 needs 42.86% to regain a $500,000 account balance; without the withdrawal, the recovery hurdle is 33.33%.
The withdrawal funded spending and is not an investment loss. The larger hurdle concerns restoring the original account balance after that spending. This one-withdrawal example is not a full retirement simulation. With repeated withdrawals, the order of gains and losses becomes important; see compounding with withdrawals and return sequence.
Essential spending, other income, time horizon and liquidity affect how much market risk a retiree can bear. Cash and fixed-income reserves can help meet near-term obligations, but introduce inflation, opportunity-cost, interest-rate or credit considerations of their own.
How Policy Responses and Forecasts Should Be Interpreted
Central banks can adjust rates and other tools; governments can change spending, taxes and transfers. Automatic stabilizers, including parts of unemployment-benefit and tax systems, respond to changing conditions without requiring a new intervention for each downturn.
Policy can cushion an economic recession, but its effects depend on the shock, financial conditions, implementation delays and inflation. Supporting demand during a supply-driven inflation problem can involve difficult trade-offs. No intervention guarantees an immediate recovery.
Reading an economic recession forecast
Check the forecast horizon, data vintage, model and event definition. A probability for the next three months is not comparable with one covering two years. Yield-curve, labor-market and financial-condition models use different evidence and may disagree.
Revised GDP or employment data can change the apparent historical performance of a model. A relationship that worked in past episodes may not behave identically under new conditions. Finally, predicting an economic recession and predicting asset prices are separate tasks: the market may already reflect considerable weakness or may react to new information differently.
A Practical Economic Recession Review
- Identify essential expenses, debt payments and commitments that could force asset sales.
- Review how employment or business income could change alongside investment values.
- Examine concentration, overlapping holdings, borrowing and margin exposure.
- Match asset allocation and liquidity to the timing of financial obligations.
- For companies, examine cash flow, refinancing requirements and competitive position.
- For ETFs, inspect holdings, strategy, expenses, credit exposure and interest-rate sensitivity.
- Distinguish a change in your financial circumstances from a reaction to one forecast.
Connect that review with ETF portfolio construction, whole-share ETF rebalancing and the portfolio maintenance workbook. The market correction decision guide applies the same emphasis on liquidity, leverage and financial obligations.
Common Misconceptions About an Economic Recession
A recession is not automatically two negative GDP quarters, a fixed six-month event or a recurring date on a calendar. The NBER evaluates broad evidence, and durations vary. The 2020 contraction was only two months under its chronology.
An economic recession does not require a stock-market crash, and a bear market does not prove a recession. Stocks can recover before the economic trough. Unemployment can remain elevated or keep rising after that trough, and lower rates do not instantly repair distressed borrowers or lenders.
Businesses and investments do not all respond alike. Defensive sectors are not risk-free, dividends do not prevent capital losses, and bonds do not invariably rise. Historical relationships provide context; they do not guarantee a future portfolio outcome.
Frequently Asked Questions
What is a recession in simple terms?
An economic recession is a significant, broad contraction in activity. U.S. dating considers multiple measures of employment, income, production and spending rather than relying on one headline.
Who dates U.S. recessions?
The NBER’s Business Cycle Dating Committee maintains the widely accepted chronology. Its turning-point announcements are retrospective; the organization is not a government agency.
Are two negative GDP quarters enough to declare one?
They are a common shorthand, not the exclusive NBER test. The committee evaluates depth, diffusion and duration across a wider body of evidence.
Which recession indicators matter?
Employment, real income, real spending, production, sales and GDP help reveal the breadth of weakness. Forward-looking measures and credit conditions add context but can give misleading signals.
What does the Sahm Rule threshold mean?
It is a rise of at least 0.50 percentage points in the latest three-month U3 unemployment average relative to the minimum three-month average from the previous twelve months. It is an indicator signal, not an official recession determination.
Does an inverted yield curve guarantee an economic recession?
No. The selected maturities, forecast horizon and economic environment matter. The curve is not a precise countdown or a stock-market entry-and-exit rule.
How long do recessions last?
There is no fixed length. The selected U.S. episodes include two months in 2020 and eighteen months in 2007–2009. These measure contraction duration, not complete economic or market recovery.
What is the difference between recession and depression?
Depression usually describes an exceptionally severe and prolonged downturn, but there is no single universally accepted numerical definition comparable to the NBER recession chronology.
Can stocks rise during a recession?
Yes. Prices can improve when expectations change even while current economic data remain weak. The recession label alone does not determine the next market return.
Is cash always the best asset during an economic recession?
Cash can provide liquidity, but long-term holdings involve opportunity costs and inflation risk. The appropriate allocation depends on obligations, time horizon and capacity to withstand losses.
Can unemployment rise after the recession ends?
Yes. A trough marks the aggregate economic turning point, not the date when every indicator or household recovers. Labor-market adjustment can continue afterward.
Does positive GDP growth mean the recession is over?
Not automatically under the NBER framework. A turning-point determination requires broader evidence, and a return to positive growth need not restore the previous activity level.
What is a soft landing?
It generally describes an economic adjustment that eases inflation or other pressures without a major contraction. It is not a precise universal statistical category.
How should long-term investors prepare?
Review liquidity, financial obligations, debt, diversification and whether the portfolio’s risks match the investment horizon. An economic recession forecast should not replace an assessment of those circumstances.
Understanding an Economic Recession Without Predicting Every Cycle
An economic recession concerns production, income, employment and spending. Markets connect with those fundamentals through expectations, cash flows and financing, but business-cycle dates and stock-price turning points do not move in lockstep.
The useful questions are therefore practical as well as statistical: what is weakening, how broad is it, what obligations must still be funded, and which risks does the portfolio actually hold? Understanding the mechanisms can improve those decisions without pretending that one indicator predicts the next contraction or recovery.
Explore the Earlier Market-Risk Pillars
Connect the economic cycle with the eleven earlier pillars on market-price declines, historical evidence and portfolio decisions.
Continue Learning in the Invest & Compound Academy
Connect economic recession analysis with financial-market definitions, risk indicators and practical planning.
Economic cycles, market risk and portfolio strategy
Market Correction Pillar | Indexes and Markets | Portfolio Construction
Sources and Further Reading
Reference review: October 18, 2026. U.S. economic chronology and measurement conventions are identified in the article. Historical recession dates are economic peaks and troughs, not stock-market dates. The selected six-episode graphic uses the NBER chronology reproduced in the cited Federal Reserve publication. The Sahm illustration and both calculators use hypothetical defaults; no current recession assessment or live data feed is provided.
- NBER: Business Cycle Dating Procedure — Frequently Asked Questions.
- NBER: U.S. Business Cycle Expansions and Contractions — chronology and month-counting conventions.
- NBER: Business Cycle Dating — committee methodology and economic indicators.
- Federal Reserve Bank of St. Louis: All About the Business Cycle, Page One Economics, March 2023. Table 2 reproduces the six selected recession durations shown in the chart.
- Claudia Sahm / FRED: Real-time Sahm Rule Recession Indicator, methodology and data-vintage notes.
- U.S. Bureau of Economic Analysis: Gross Domestic Product — data, definitions and annual-rate reporting.
- U.S. Bureau of Labor Statistics: Employment Situation — labor-market measures and explanatory notes.
- SEC Investor.gov: Asset Allocation and Diversification.
This article provides general financial education and information, not personalized investment, financial, legal or tax advice or a recommendation to buy, sell or hold a security.
Economic indicators can be revised, forecasting relationships can change, and historical recession dates do not establish future market returns. Hypothetical examples disclose their assumptions and do not predict the next recession, investment loss or recovery date.
Investments can lose principal permanently. Diversification, asset allocation and rebalancing do not guarantee profits or eliminate market risk. Consider your financial circumstances and consult qualified professionals where appropriate.