Dividend Reinvestment Calculator: Shares, Cash and Total Return
Model dividend reinvestment without counting the same cash twice. Compare fractional shares, whole-share purchases and retaining distributions as cash.
A dividend reinvestment calculator should show more than a rising share count. It should track cash paid out, the purchase price of new shares, residual cash, costs and combined portfolio value. Reinvestment keeps distributed capital exposed to future investment returns; it does not create an immediate gain. This guide models fractional shares, whole-share restrictions and retaining distributions as cash. It also shows why distribution yield cannot be substituted for total return. The worked examples are hypothetical and the tools state exactly how prices and payouts interact.
Our dividend yield versus total return guide develops the performance distinction, while compound interest examples compares savings, reinvestment and debt. This article concentrates on the operational question: how does each distribution change shares, cash and investor wealth?
Try the Dividend Reinvestment Calculator
What Is Dividend Reinvestment?
Dividend reinvestment is the practice of using cash dividends or other eligible distributions to acquire additional investment shares rather than retaining or spending the cash. The process is often described using the abbreviation DRIP, meaning dividend reinvestment plan. In a conventional company-sponsored DRIP, an eligible shareholder may arrange for dividends to be reinvested into additional shares of the same company’s stock. Brokerages may also provide reinvestment services for certain stocks, ETFs, and other eligible securities. The U.S. Securities and Exchange Commission explains that investors should examine the terms of a dividend reinvestment program, including whether fees apply.
Reinvestment Versus Cash Distribution
Consider two investors who each own 100 shares of a fund. The fund pays a $1 distribution per share. Both investors receive an economic distribution of $100. Investor A retains the money as cash. Investor B purchases additional fund shares. Immediately following the transaction, the investors hold different combinations of shares and cash. Investor A owns the original 100 shares plus $100 cash. Investor B owns more than 100 shares and has less cash. The key difference is investment exposure. Investor B has committed the distributed cash back into the market.
Reinvestment Does Not Require Additional Savings
A dividend reinvestment purchase uses cash generated from existing investments. That differs from depositing additional money from salary or another income source. Both activities can increase share ownership. However, they should be tracked separately when evaluating contributions and investment returns.
Automatic and Manual Reinvestment
Automatic reinvestment occurs when an eligible plan or brokerage service purchases shares using distributions without requiring the investor to place each order manually. Manual reinvestment requires the investor to receive cash and then enter a purchase order. Availability depends on the account, security, broker, and plan terms. The ETF label does not guarantee that automatic reinvestment is supported.
How Dividend Reinvestment Works Step by Step
A simplified dividend reinvestment process contains several stages. The company or fund declares a distribution and publishes the relevant dates. Investors must meet the applicable entitlement requirements. Eligible shareholders then receive the distribution on the payment date. A reinvestment program uses the available cash to purchase additional shares according to its rules. Finally, the investor’s share balance increases by the number of shares acquired. The exact purchase date and price depend on the plan or broker.
Dividend Declaration
A company or fund announces information about an eligible distribution. The announcement may include the amount, record date, ex-dividend date, and payment date. These dates serve different purposes.
Ex-Dividend Date
The ex-dividend date helps determine which transactions carry entitlement to the distribution under the applicable settlement and exchange rules. Investors should not assume that purchasing shares immediately before an announced payment produces an economic windfall.
Payment Date
The payment date is when eligible distributions are made according to the security’s procedures. A brokerage may credit the amount to the investor’s account on or near that date.
Reinvestment Date
Automatic reinvestment may occur according to broker or plan arrangements. The purchase price may differ from the stock’s price when the distribution was announced. This matters because the number of new shares depends on the actual reinvestment price.
Why Timing Matters
A stock or ETF price can change between the announcement, ex-dividend date, payment date, and reinvestment purchase. A calculator assuming every distribution purchases shares at a fixed price is making a simplification. It may be acceptable for demonstrating the concept, but it should be disclosed.
The Basic Dividend Reinvestment Formula
The number of shares that can be purchased with a distribution is determined by the available cash and the execution price.
This formula assumes fractional shares are permitted and transaction costs are zero. The next share balance is:
For a security paying a distribution per share:
Combining the relationships:
These formulas establish the basic mechanics of reinvestment. They do not determine the future price of the security or guarantee that distributions will remain unchanged.
Use how to measure investment growth to reconcile the entire account. A distribution-funded purchase is an internal use of investment cash; it is not new capital contributed by the owner.
Example: Reinvesting a $100 Dividend
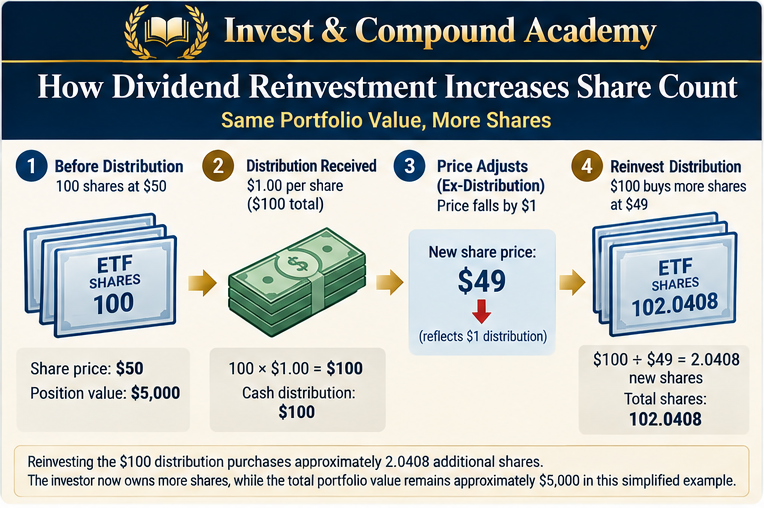
Suppose an investor owns 100 shares of an ETF. The distribution is $1 per share. The cash payment is: 100 × $1 = $100. Assume the reinvestment purchase price is $49. The investor can purchase: $100 ÷ $49 = approximately 2.040816 shares. The new balance becomes: 100 + 2.040816 = approximately 102.040816 shares.
What Happens to the Investment Value?
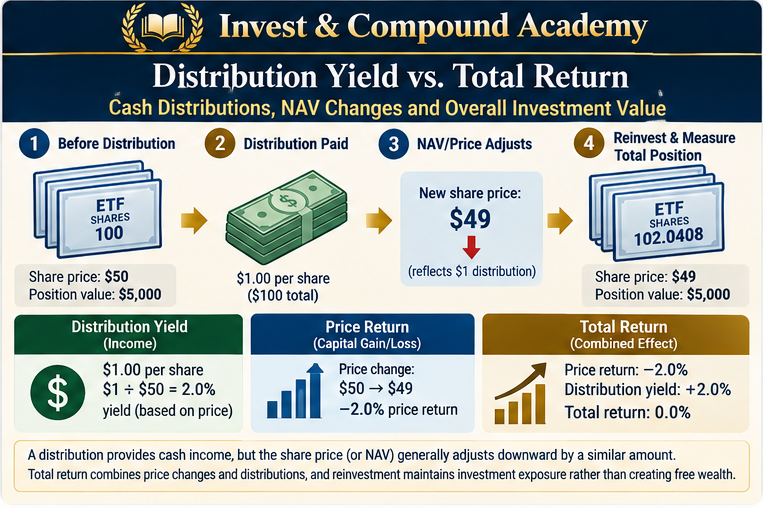
Before the distribution, suppose the ETF traded at $50. The initial position was worth: 100 × $50 = $5,000. If the fund’s price falls to $49 because of the $1 distribution, with all other market effects assumed absent, the original shares would be worth: 100 × $49 = $4,900. The investor also receives $100 in cash. Combined value: $4,900 + $100 = $5,000. If the $100 is reinvested at $49, the investor owns approximately 102.040816 shares. At $49 each: 102.040816 × $49 ≈ $5,000. The investor owns more shares, but the economic value remains approximately unchanged in this deliberately simplified example.
Why This Example Matters
The additional 2.040816 shares were not free wealth. They were purchased using cash transferred out of the fund through its distribution. Future returns will depend on what happens to the investment after reinvestment. This is the foundation of accurate DRIP analysis.
Dividend Reinvestment Does Not Create a Guaranteed Return
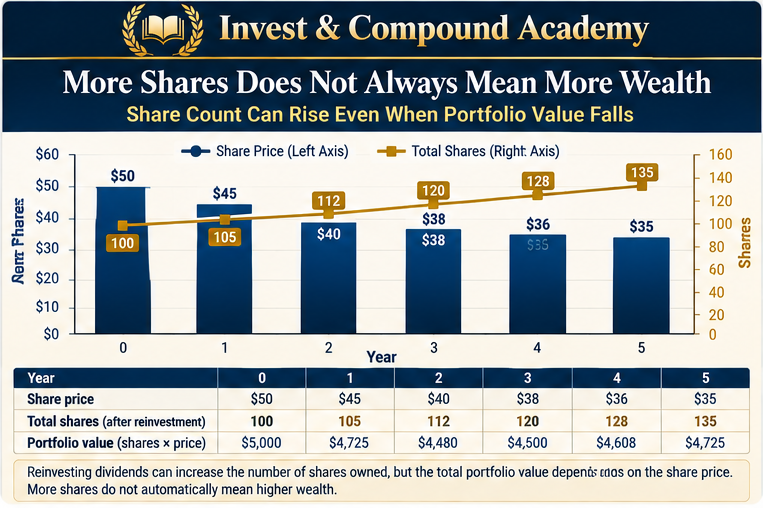
A common misunderstanding is that a reinvested distribution produces investment growth simply because the share count rises. But share count alone does not determine total wealth. An investor’s economic position depends on the value of the shares plus cash and other relevant assets.
A reinvestment transaction changes the proportions between securities and cash. It does not automatically increase total position value.
Example: More Shares, Lower Wealth
Suppose an investor begins with 100 shares worth $50 each. The total value is $5,000. Distributions are reinvested over several periods, increasing the share balance to 115. However, suppose the final share price declines to $35. The position is worth: 115 × $35 = $4,025. The investor owns more shares than before. Yet the portfolio is worth $975 less.
What Must Be Evaluated?
A proper analysis considers the ending share price, shares owned, distributions received, retained cash, outside contributions or withdrawals, costs and relevant taxes. A growing share balance can support future income if distributions continue, but it cannot substitute for measuring investment performance.
Dividend Yield vs. Dividend Growth
Dividend yield and dividend growth describe different characteristics. Dividend yield compares a distribution amount with a reference price. Dividend growth describes changes in the distribution per share over time. Neither alone establishes the investor’s total return.
Dividend Yield
A simplified forward annual distribution yield can be calculated as:
Suppose a stock trades at $50 and is expected to pay $2 annually. Its indicated forward yield is 4%. The calculation relies on the expectation that the distributions will be made. It is not a guaranteed future payment.
Dividend Growth
Suppose the annual dividend increases from $2 to $2.10. The dividend growth rate is: ($2.10 ÷ $2) − 1 = 5%. The distribution per share has increased by 5%.
Why Both Matter
An investor interested in future cash flow may consider the starting yield and the potential rate of dividend growth. However, companies may reduce dividends. A high yield can arise because the share price has fallen. And a low current yield can coexist with strong earnings growth or share-price appreciation. A useful analysis should consider cash generation, payout sustainability, valuation, and total return.
Our dividend-yield guide explains the ratio and its reference price. The SCHD guide discusses a dividend-equity mandate; a distribution assumption is not interchangeable with a guaranteed growth rate.
How Dividend Growth Changes Reinvestment Projections
A simple DRIP projection may assume that distributions remain constant. A more advanced model can incorporate a dividend growth rate. Suppose a hypothetical company pays $2 per share annually. Assume the dividend increases 4% each year. The projected dividend after one year would be $2.08. After two years, approximately $2.1632. After ten years: $2 × 1.04^10 ≈ $2.96.
The Dividend Growth Formula
This provides a mathematical scenario under a constant growth assumption. It does not establish that the company will actually increase dividends at that rate.
Dividend Growth and Share Accumulation
If the investor reinvests distributions, future cash payments may rise because of two effects. First, dividends per share may increase. Second, the investor may own more shares. These effects can reinforce each other. However, they can also be offset by falling share prices, dividend cuts, costs, or changes in business conditions.
The Risk of Extrapolating Dividend Growth
A company cannot necessarily increase dividends faster than its cash-generating capacity indefinitely. Dividend growth assumptions should be evaluated against earnings, free cash flow, payout ratios, balance-sheet strength, and capital allocation. A calculator should allow users to model dividend cuts as well as increases.
Understanding Distribution Frequency
Dividend-paying investments may distribute cash monthly, quarterly, semiannually, or annually. Some follow irregular schedules. The frequency determines how often cash becomes available for reinvestment. However, more frequent payments do not automatically mean higher total returns.
Monthly Distributions
A monthly-paying fund provides more frequent cash payments. Those payments may be reinvested each month if brokerage arrangements allow.
Quarterly Distributions
A quarterly-paying fund typically makes four distributions annually. The cash may remain within the portfolio between payments or be paid to the shareholder.
Annual Distributions
An annual-paying investment may make one distribution each year.
Why Frequency Alone Does Not Determine Performance
Suppose two otherwise identical investments distribute the same total annual amount. One pays monthly. The other pays quarterly. The timing of cash availability differs. But the investment outcome also depends on the fund’s underlying returns, ex-distribution price adjustments, reinvestment execution prices, and other factors. It would be misleading to conclude that the monthly payer must outperform purely because reinvestment occurs more frequently.
Model Consistency
A calculator should specify whether an annual distribution amount is divided evenly across periods. For example, a hypothetical $2.40 annual distribution can be modeled as $0.20 monthly or $0.60 quarterly. Actual fund distributions may not follow those equal amounts.
Fractional Shares vs. Whole Shares
One of the most consequential practical details is whether the investor can reinvest distributions into fractional shares. A fractional share represents less than one whole share. The SEC explains that brokerage policies for fractional-share transactions differ, including order restrictions, fees, and other limitations.
Fractional-Share Reinvestment
Suppose an investor receives $35. The ETF trades at $70. With fractional shares, the distribution could purchase 0.5 share. The cash is fully deployed, ignoring fees.
Whole-Share Reinvestment
Under a whole-share restriction, $35 is insufficient to buy a $70 share. No share can be purchased using only that distribution. The $35 remains cash. It may be combined with later distributions, subject to brokerage capabilities.
Why Residual Cash Matters
A whole-share account may accumulate cash between purchases. That money is no longer exposed to the ETF’s market movements until reinvested. If the ETF rises, the delayed investment misses some appreciation. If the ETF falls, the cash avoids that decline. The difference is not always large, but it can become meaningful depending on portfolio size, distribution amounts, and share prices.
Whole-Share Formula
Here, floor means rounding down to the nearest whole number. The remaining cash is:
The calculation should also subtract any applicable transaction fee before determining available purchasing power.
Whole-Share DRIP Example With Residual Cash
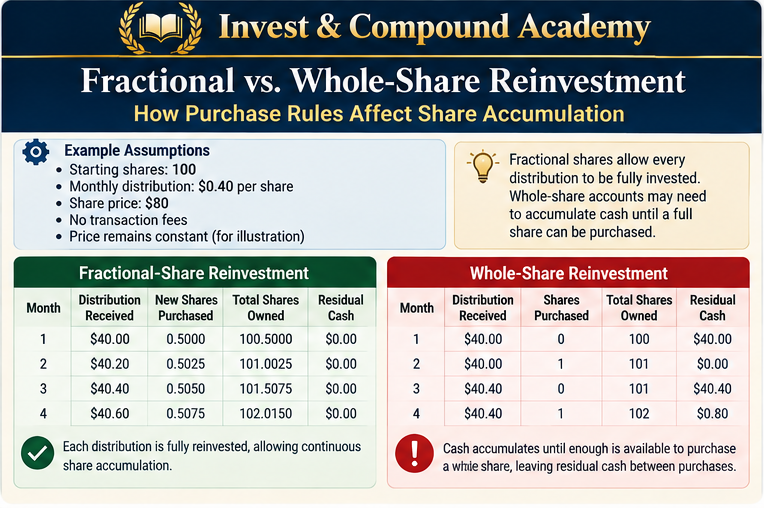
Suppose an ETF trades at a constant hypothetical price of $80. An investor begins with 100 shares. The fund pays a cash distribution of $0.40 per share each month. The account permits only whole-share purchases. Assume no transaction fees and the same $80 post-distribution purchase price on every modeled payment date. Holding that price steady while cash is paid out implicitly requires offsetting investment gains. It is a purchase-timing illustration, not a zero-return fund scenario.
First Distribution
The investor owns 100 shares. Monthly distribution: 100 × $0.40 = $40. One ETF share costs $80. The account cannot purchase a share yet. Residual cash is $40.
Second Distribution
The investor receives another $40. Accumulated cash becomes $80. The account can purchase one additional share. The investor now owns 101 shares, and residual cash is zero.
Third Distribution
The next distribution is: 101 × $0.40 = $40.40. No whole share can be purchased with $40.40 at an $80 price. The cash remains available.
Fourth Distribution
Another $40.40 arrives. Accumulated cash becomes $80.80. One additional share can be purchased for $80. The investor now owns 102 shares. Residual cash is $0.80.
What the Example Demonstrates
Whole-share reinvestment can still accumulate additional shares over time. However, purchases happen in steps rather than continuously. Residual cash must be tracked. A calculator assuming every distribution is fully converted into shares would overstate the number of shares purchased in this scenario.
The whole-share ETF rebalancing workbook follows rounding and funded trades. Here, accumulated cash is deliberately pooled for later purchases. Verify whether your broker does that automatically or whether manual orders are needed.
Why Broker DRIP Rules Matter
Brokerages may handle reinvestment differently. Some programs automatically purchase whole shares and leave residual cash. Others support fractions. Some may provide reinvestment through a special program with its own pricing or timing conventions. Certain securities may be ineligible for automatic reinvestment.
Questions to Ask the Broker
An investor should understand whether the security is DRIP-eligible, whether fractional shares are supported, how cash is handled, how the purchase price is determined, and whether fees apply.
Manual Reinvestment
If the broker does not offer an automatic plan for a particular ETF, the investor may accumulate cash and make purchases manually. That process can still support long-term share accumulation. However, it requires decisions about trading timing and order execution.
Reinvestment Discounts
Some company-sponsored plans may offer particular purchase arrangements or discounts. Those terms are plan-specific and should not be assumed for every company or ETF.
Account Restrictions
Registered accounts, retirement plans, custodial arrangements, and brokerage platforms may impose different operational restrictions. A calculator should make its assumed purchase rules explicit.
The ETF research guide helps connect a reinvestment choice with fund strategy and costs. ETF versus mutual funds compares wrappers; it does not establish which securities a broker makes eligible for DRIP.
How to Model Dividend Reinvestment Over Time
A realistic dividend reinvestment model progresses period by period. Rather than relying on one fixed compound-growth percentage, it updates shares, cash, prices, and distributions at each payment date.
Beginning Share Balance
The model starts with the number of shares currently owned.
Distribution Calculation
The number of eligible shares is multiplied by the distribution per share.
Cash Available
The new distribution is added to any residual cash carried forward.
Reinvestment Purchase
The simulator calculates how many shares can be purchased at the selected execution price.
Ending Share Balance
The newly acquired shares are added to the original balance.
Remaining Cash
Any unspent amount remains available under the model’s cash-handling assumption.
Next Period
The model repeats using updated share balances, distribution amounts, and market prices. This approach can support both fractional-share and whole-share scenarios. It is more transparent than assuming that every stated distribution rate converts directly into portfolio growth.
A Period-by-Period Model
Let the share balance at the beginning of period t be S. Let the cash distribution per share be D. Let the reinvestment purchase price be P. Let the carried cash be C. The total available cash before fees is:
For fractional shares and no fees:
For whole shares:
The ending share balance becomes:
Residual cash is calculated after the purchase.
Additional Contributions
If the investor contributes external cash, that amount should be tracked separately.
A high-quality calculator should show contributions independently from distributions to avoid conflating savings with investment returns.
Changing Prices
The reinvestment price can change each period. A calculator could allow readers to enter a sequence of prices or use an explicitly hypothetical growth assumption. Historical backtests would require actual price observations adjusted for corporate actions and distribution timing.
Distribution Changes
A model may also allow increases, reductions, or suspensions. This produces more realistic sensitivity analysis than assuming indefinitely rising payouts.
The Difference Between Share Growth and Wealth Growth
A DRIP calculator should report at least two principal results. The first is the ending number of shares. The second is the combined value of those shares and remaining cash. These measurements are related but not interchangeable.
Share Growth
Suppose share ownership increases from 100 to 135. The number of shares has increased by 35%.
Portfolio Value
Suppose the final share price is $40. The ending security value is: 135 × $40 = $5,400. If the starting position was 100 shares at $50, it was initially worth $5,000. The ending position is worth $400 more, before considering external cash flows, taxes, and expenses.
A Different Final Price
If the final share price is $30, the same 135 shares are worth $4,050. Share accumulation is identical. Wealth is lower.
Why Investors Should Monitor Both
More shares can support additional future cash flow if distributions per share continue. But the portfolio’s purchasing power depends on its overall economic value. A professional calculator should emphasize both metrics rather than treating share accumulation as a substitute for total return.
Dividend Reinvestment vs. Taking Cash
Investors commonly compare two approaches. Under reinvestment, distributions purchase more shares. Under cash withdrawal or retention, the investor keeps the distribution outside the investment. The appropriate choice depends on investment objectives.
Accumulation Strategy
An investor seeking long-term portfolio growth may prefer reinvestment because the cash remains exposed to the investment strategy.
Income Strategy
An investor funding living expenses may prefer receiving distributions in cash. Reinvestment would require finding another source of money for those expenses.
A Fair Comparison
A comparison should measure total wealth, including the cash retained by the non-reinvesting investor. Simply comparing share balances unfairly favors reinvestment.
Example
Suppose two investors begin with $5,000 in the same ETF. Both receive a $100 distribution. Investor A keeps the cash. Investor B reinvests it. Immediately after the payment and transaction, with no unrelated price movement or costs, neither has gained an automatic wealth advantage. The differences emerge later because one investor holds more shares and the other holds more cash. If shares subsequently rise, reinvestment can benefit. If they fall, retaining cash can benefit. The choice changes exposure to future investment returns.
A Dividend Reinvestment Calculator Must Avoid Double-Counting Returns
One of the most common problems with dividend calculators is double-counting investment returns. Suppose a model assumes the portfolio earns an 8% annual total return. It then adds a 5% distribution yield to that 8%. This may incorrectly produce a projection resembling 13% annual growth. But total return already includes distributions under the relevant measurement convention.
Correct Total-Return Interpretation
For a one-period simplified scenario:
This formula assumes one share, no additional cash flows, and consistent timing.
Example
Beginning share price: $100. Ending share price: $104. Distribution: $5. Total return: ($104 − $100 + $5) ÷ $100 = 9%. The price gain is 4%. The distribution contributes another 5% relative to the beginning price. The total return is 9%, not 14%.
Why Reinvestment Calculations Require Care
If the investor reinvests the distribution before the end of the period, the purchased shares may themselves gain or lose value. A detailed simulator can account for that timing. But the model should not treat a total-return assumption and a distribution yield as two independent sources of return unless the assumptions have been defined to avoid overlap.
Dividend Yield Can Increase When Prices Fall
A high yield may look attractive to income investors. But yield can rise because the security’s market price has declined.
Example
Suppose a stock pays an annual dividend of $4. At a $100 share price, its indicated yield is 4%. If the share price declines to $50 and the annual dividend remains $4, the indicated yield rises to 8%. The company has not increased the dividend. The higher yield results entirely from the lower price.
Dividend-Cut Risk
If the business weakens, the dividend may subsequently be reduced. Suppose the annual dividend falls from $4 to $2. At a $50 share price, the indicated yield returns to 4%.
Why High Yield Is Not Automatically Attractive
An unusually high yield may reflect market concerns about dividend sustainability. Investors should examine earnings, free cash flow, debt, payout ratios, and the company’s competitive position. A DRIP strategy magnifies exposure to the chosen investment over time. It should not be implemented without evaluating the underlying risks.
Dividend Reinvestment and Total Return
Total return combines changes in investment value with cash distributions according to a defined measurement convention. For income-focused portfolios, it is often more informative than distribution yield alone.
Price Appreciation
A company or fund may increase in value over time.
Cash Distributions
The investment may pay dividends, interest, capital gains distributions, or other forms of cash.
Reinvestment
Reinvested distributions can acquire additional securities that participate in future returns.
Total-Return Measurement
A total-return series usually follows specified assumptions concerning reinvestment and corporate actions. Different conventions may produce different measured outcomes.
Why Reinvestment Matters to Total-Return Indexes
Some financial-market indexes are published in both price-return and total-return versions. Price-return indexes exclude ordinary reinvested distributions. Total-return indexes incorporate them according to the index methodology. Investors should avoid comparing an ETF’s total return with a price-only benchmark without recognizing that difference.
See dividend yield versus total return for the broader performance comparison. How the S&P 500 works explains benchmark construction. Always identify whether an index comparison includes reinvested distributions.
The Special Case of Covered-Call ETFs
Covered-call ETFs often distribute substantial amounts of cash. Some use option-writing strategies to generate option premiums. Others may combine options with underlying dividend income or other investment techniques. The economic treatment of distributions requires particular care.
Option Premiums Are Not Guaranteed Investment Gains
Writing a call option generates a premium. However, the strategy may limit upside participation when the underlying asset appreciates above the option’s effective strike exposure. The portfolio can also decline when the underlying asset falls.
Distribution Rate vs. Economic Return
A covered-call fund may distribute an amount equivalent to a high percentage of its current market price. But that does not establish an equally high sustainable compound total return. The underlying fund NAV may decline.
Return of Capital
Some fund distributions may be classified as return of capital for tax reporting purposes. The SEC’s fund-distributions bulletin explains that payouts may include returned capital. Tax classification alone should not be used as a complete measure of economic performance; examine NAV and total return alongside the distribution records. The SEC also cautions investors against relying solely on distribution rates to evaluate performance.
What a DRIP Calculator Should Show
For a covered-call ETF, useful outputs include share count, distributions, NAV or price assumptions, remaining cash, and total portfolio value. A model that assumes a high cash payout is continuously reinvested while also assuming uninterrupted price appreciation may substantially overstate potential growth. The assumptions should be realistic and clearly separated.
For the underlying strategies, see JEPI, JEPQ, SPYI and QQQI. Our covered-call ETF financial-report workbook examines operations, distributions and net assets. Reinvestment cannot establish whether a payout is economically sustainable.
Distribution Growth vs. Total-Return Growth
A dividend model may assume distributions grow at a certain annual rate. A portfolio-growth model may separately assume a change in market price. These are different assumptions, but they are financially connected.
An Illustrative Model
Suppose a security begins at $50 and pays $2 annually. Its initial distribution yield is 4%. Assume the dividend per share grows 3% annually. Also assume its price grows 4% annually in the projection. The model can calculate future prices, distributions, and share purchases.
Why This Is Only a Scenario
The price and dividend paths are not independent facts. They depend on business performance, investor expectations, and financial conditions. A constant-growth model is useful for sensitivity analysis, but actual dividends and prices can change irregularly.
Avoiding Overly Optimistic Inputs
Investors may unintentionally combine high dividend growth, high price appreciation, and high starting yields in a way that implies extraordinary long-term returns. The calculator should make these assumptions visible. If the resulting projections appear implausibly large, readers should examine the assumptions rather than simply trust the ending value.
How Reinvestment Can Affect Long-Term Cash Income
Dividend reinvestment can increase the future number of shares eligible for distributions. If the distribution per share remains stable or rises, the total cash amount may increase.
A Simplified Example
An investor starts with 100 shares paying $1 annually. The initial annual distribution is $100. Reinvestment increases ownership to 120 shares. If the dividend remains $1, the next annual distribution would be $120. If the dividend increases to $1.10, the distribution would be: 120 × $1.10 = $132.
Why Share Growth and Dividend Growth Reinforce Each Other
The investor receives income on additional shares. At the same time, each share may distribute more cash if the company increases its payout. These effects can compound.
What Could Interrupt the Process?
Dividend cuts, suspended payments, falling share prices, fund closures, transaction costs, taxes, account restrictions and changing cash needs can all interrupt the process. A long-term projection should account for uncertainty rather than assume the favorable pattern continues indefinitely.
The compound interest examples workbook puts reinvestment beside savings and borrowing. Our Rule of 72 calculator estimates doubling using compound growth assumptions; entering distribution yield instead can misrepresent wealth growth.
Dividend Reinvestment and Inflation
Investors often use dividend income to support current or future spending. But the purchasing power of a fixed nominal distribution declines when consumer prices rise.
A Fixed Dividend Example
Suppose an investor receives $5,000 annually in cash distributions. If that amount remains fixed for twenty years while inflation averages 3%, the payment’s purchasing power becomes: $5,000 ÷ 1.03^20 ≈ $2,768 in today’s dollars.
Dividend Growth and Inflation
A company increasing distributions over time may help offset inflation. However, dividend increases are not guaranteed. A dividend growing at 2% annually while inflation averages 4% would lose purchasing power under those constant assumptions.
Reinvestment vs. Spending
An investor reinvesting distributions is not using those payments for present consumption. The objective is future capital accumulation. An investor spending distributions must evaluate whether the income keeps pace with expenses. These are different financial objectives.
Inflation-Adjusted Calculator Results
Translating future amounts into current purchasing-power equivalents provides a more useful long-term perspective than nominal share-count growth alone. The main calculator displays inflation-adjusted ending wealth for its fractional-reinvestment scenario.
The inflation and investing pillar develops purchasing power. The $10,000 twenty-year growth guide compares nominal and real outcomes. Economic recessions address declining activity, a separate risk to earnings and payouts.
Reinvestment and Portfolio Concentration
Automatically reinvesting distributions into the same security increases exposure to that investment. This may align with the investor’s intended portfolio strategy. However, it can also increase concentration.
Single-Stock Concentration
Suppose an investor owns shares of one company and reinvests every dividend into that company. Over time, the investor’s number of shares may increase. If the company performs well, the strategy can generate significant gains. If it experiences financial difficulties, the investor’s accumulated exposure may magnify losses.
Sector Concentration
An investor holding several dividend funds may believe the portfolio is diversified. However, the funds may own many of the same companies or emphasize similar sectors.
Portfolio-Level Reinvestment
Instead of automatically purchasing the distributing security, an investor may direct cash toward other assets. For example, distributions from an overweight equity position could be used to purchase an underweight bond fund. This is not a conventional same-security DRIP, but it can serve a portfolio-rebalancing objective.
Why the Objective Matters
Reinvestment is a capital-allocation decision. The best destination for distributions is not automatically the security that generated them. Investors should evaluate the entire portfolio.
Use ETF portfolio construction and the maintenance workbook to connect reinvestment with allocation. VOO and VTI overlap illustrates why owning several funds does not automatically create distinct exposures.
Dividend Reinvestment and Taxes
Tax treatment is particularly important for investors using taxable brokerage accounts. In the United States, reinvested taxable dividends generally do not escape taxation merely because the investor used the cash to purchase additional shares. The IRS explains that shares acquired through a dividend reinvestment plan have a cost basis associated with their acquisition, subject to applicable adjustments.
A Taxable-Account Example
Suppose an investor receives a $200 taxable dividend. The investor reinvests the full $200. The reinvestment purchases additional shares. However, the dividend may still be taxable in the year received under applicable rules. The investor may need other cash to pay the resulting tax.
Cost Basis
Reinvested purchases create additional acquisition records. Those records can become important when shares are eventually sold. The cost basis and tax consequences depend on the jurisdiction and applicable rules.
Return of Capital
Return-of-capital distributions may reduce the investment’s adjusted cost basis under relevant tax law. They should not be treated as ordinary dividend income without examining the official classification.
Registered Accounts
The tax treatment may differ in retirement and registered savings accounts. For Canadian investors, RRSPs, TFSAs, and other eligible accounts have different rules. A U.S. tax explanation should not be applied automatically to a Canadian resident’s circumstances.
Currency Considerations
Foreign distributions and purchases may require currency conversion. The timing and exchange rates used for tax reporting may differ from the brokerage’s displayed investment performance. A sophisticated calculator may allow transaction-cost modeling, but a generalized tool should not claim to perform precise jurisdiction-specific tax calculations without the required information.
Dividend Reinvestment for Canadian Investors
Canadian investors may hold Canadian-listed ETFs, U.S.-listed ETFs, or individual dividend-paying stocks. Reinvestment arrangements depend on the brokerage and the specific security.
Canadian-Listed ETFs
Some Canadian brokers support automatic reinvestment for eligible Canadian-listed ETFs. Fractional-share treatment and residual cash rules vary.
U.S.-Listed ETFs
Investors receiving U.S.-dollar distributions may retain the cash in U.S. dollars when their account supports that arrangement. Other accounts may convert currencies according to brokerage rules.
Whole-Share Accounts
Investors using accounts restricted to whole shares should not assume that an advertised distribution can be completely reinvested each month. The actual purchase depends on available cash and share price.
Canadian Tax Reporting
In nonregistered accounts, investors may need to track adjusted cost base and the classification of fund distributions. Tax treatment may differ for eligible dividends, foreign income, capital gains, and returns of capital. The applicable rules are fact-specific.
Currency-Adjusted Performance
If an investor measures wealth in Canadian dollars while holding U.S.-dollar securities, foreign-exchange movements affect the result. A U.S.-dollar portfolio can rise while its Canadian-dollar return is lower, or vice versa. A calculator should identify its modeling currency.
The ETF beginner’s guide explains fund ownership, while ETF versus stock distinguishes pooled exposure from a single company. Canadian and U.S. listings can involve different currency and distribution-reporting arrangements.
Reinvesting Dividends vs. Making New Contributions
Dividend reinvestment and dollar-cost averaging can occur together. But they differ in the source of cash used for purchases.
Reinvestment
Cash distributions generated by existing investments are used to purchase additional shares.
New Contributions
The investor deposits additional money from outside the portfolio. This increases contributed capital.
Combined Strategy
Suppose an investor receives $50 monthly in distributions and contributes another $250 from employment income. The investor may invest $300 during the month. But only $250 represents new outside capital. The $50 is a distribution associated with existing holdings.
Why the Difference Matters
A calculator reporting all $300 as investment earnings would misrepresent the contribution source. A calculator reporting all $300 as outside contributions would also be inaccurate. A proper model separates distributions, external deposits, reinvestments, and investment performance. This provides clearer information about how wealth is changing.
Our dollar-cost averaging pillar follows recurring outside savings. Lump-sum investing versus DCA examines deployment of existing cash. Keep those funding decisions separate from recycling cash already distributed by a holding.
Why Fund NAV Matters for Reinvestment Projections
Net asset value represents the net value of an investment fund’s assets divided by its shares outstanding. For an ETF, its market price may trade above or below NAV. Reinvestment generally uses the applicable execution price under the brokerage’s arrangements.
Distributions and NAV
A cash distribution reduces the fund’s net assets, all else equal. The SEC explains that fund NAV generally falls when distributions leave the portfolio.
What Happens to the Investor?
The investor receives cash or additional shares after reinvestment. The decline in fund NAV is not automatically an investment loss equal to the distribution amount. It represents a transfer of value.
The Importance of Total Return
A calculation that adds distributions to unchanged NAV may overstate economic performance. For example, a fund paying a 10% cash distribution while maintaining perfectly unchanged NAV could represent a strong total-return outcome—but that combination requires underlying economic performance sufficient to support it. It should not be assumed simply because the current distribution rate is 10%.
Modeling Approach
A realistic simulation should distinguish price growth before distributions, the value transferred out through payments, and the share purchases funded by those payments. This avoids creating artificial wealth inside the model.
The ETF creation and redemption pillar explains NAV and secondary-market pricing. Execution price and NAV are related measurements, but they need not be identical when a reinvestment trade occurs.
How to Use This Dividend Reinvestment Calculator
The main dividend reinvestment calculator compares fractional reinvestment, whole-share reinvestment and retaining distributions as cash under one common fund-value path. The second calculator isolates a single distribution and the effect of reinvestment timing. Its purpose is to make the accounting visible rather than hide it inside a single growth percentage.
Starting Investment
Enter starting capital and initial price in the main tool. Fractional and cash-retention modes start with capital divided by price. Whole-share mode rounds the initial purchase down and retains unused capital. The second tool starts with a specified share count. Initial purchase fees are excluded.
Initial Share Price
The price per share determines how many shares the starting investment can purchase. If the account is whole-share-only, unused starting cash must be tracked.
Distribution Per Share
Enter the cash amount assumed per share for the first payment period. This is more transparent than entering an annualized distribution yield without identifying the actual payout. If you change payment frequency, also change the per-payment amount when you intend to preserve the same annual payout.
Distribution Frequency
Enter 12 for monthly, 4 for quarterly, 2 for semiannual or 1 for annual distributions. Choose a whole number of years; the model uses equally spaced periods.
Dividend Growth Assumption
Enter an illustrative annual change in distributions per share. Zero keeps the payment per share constant. Negative assumptions reduce subsequent payments. A −100% assumption makes payments after the first one zero. Actual cuts and suspensions do not have to follow this smooth schedule.
Share-Price Growth Assumption
Enter an effective annual gross fund-value growth assumption before distributions. Each period, the tool grows the prior post-distribution price by the equivalent periodic factor, then subtracts the payout per share. This is not an after-distribution price-appreciation input. With no costs and complete fractional reinvestment, the assumed gross growth controls total wealth; the payout determines how that wealth is divided among shares and cash.
Reinvestment Mode
All three modes are displayed together: fractional reinvestment, whole-share purchases with residual cash, and no reinvestment with cash retained at zero interest. Actual broker programs may not automatically pool residual cash in the way this model does.
Additional Contributions
These two calculators exclude outside contributions so the distribution accounting can be checked directly. Use the linked contribution and compound-growth workbooks for new savings. A reinvestment purchase is not an outside deposit.
Inflation
The main tool divides the fractional scenario’s ending nominal wealth by the cumulative inflation factor. This estimates purchasing power under a constant inflation assumption; it is not a separate account balance.
Transaction Costs
The main tool deducts a fixed fee only when a reinvestment purchase can actually occur. Whole-share purchases must cover both that fee and at least one full share. Residual cash earns no interest. Initial purchases, bid-ask spreads, currency conversion, fund expense accrual and taxes are not separately modeled; use a gross-growth assumption consistent with the costs already included.
Output Metrics
Outputs show combined ending wealth in all three modes, fractional and whole share counts, whole-share residual cash, gross distributions credited, reinvestment fees, ending price and the fractional scenario’s inflation-adjusted wealth. Gross distributions are informational: they are already represented by purchased shares or retained cash and must not be added again to ending wealth.
Transparency
Every output corresponds to a defined assumption. The model stops when a selected payout path exhausts the modeled per-share value. That message identifies an inconsistent or unsustainable mathematical scenario; it does not predict what a particular fund will do.
Example: Modeling a Five-Year Dividend Reinvestment Plan
Consider a hypothetical ETF investment with initial capital of $10,000, an initial share price of $50, 200 starting shares and a quarterly cash distribution of $0.50 per share. Assume no distribution growth, outside contributions or transaction costs, with fractional reinvestment permitted.
For the first distribution: 200 × $0.50 = $100. If the reinvestment price is $49.50 after a simplified $0.50 per-share distribution adjustment, the investor can purchase approximately 2.0202 additional shares. The next share balance becomes approximately 202.0202 shares.
What the Example Assumes
The price movement is modeled solely as a distribution adjustment for this first period. It does not include unrelated market appreciation or depreciation. The calculation is an illustration of share accumulation, not a five-year performance forecast.
Extending the Model
Each subsequent period would calculate the current distribution, update the share balance, and apply the relevant price path. The result depends on the assumptions chosen.
Why a Five-Year Projection Needs More Information
It would be misleading to announce a precise five-year ending wealth figure using only the starting dividend. The future price path, distribution amounts, reinvestment dates, fees, and cash-handling rules all matter. A transparent calculator allows those assumptions to be specified rather than hiding them.
Scenario Analysis: Stable Dividends, Rising Prices
Suppose distributions remain constant while share prices rise. Future payments can purchase fewer shares for the same cash amount. However, the existing investment’s market value may be appreciating.
The Trade-Off
Rising share prices reduce the number of shares purchased per dollar. At the same time, higher share prices increase the value of shares already owned.
Why Share Count Alone Misleads
A reinvestment strategy with relatively modest share accumulation may still produce strong portfolio value growth if prices rise substantially. Conversely, rapid share accumulation at declining prices may coexist with poor total returns. The investment outcome must include both effects.
Rising markets are only one scenario. The market-correction pillar, correction versus bear market comparison and bear-market guide provide drawdown context. Dividend reinvestment does not prevent losses.
Scenario Analysis: Falling Prices and Reinvestment
Suppose share prices decline while distributions remain temporarily stable. Each distribution can purchase more shares. This may create rapid share accumulation. However, the existing portfolio is losing market value.
A Simplified Comparison
A $100 distribution purchases two shares at $50. At $25, it purchases four shares. The second purchase doubles the number of shares acquired. But the lower share price may reflect serious financial deterioration.
What Happens If Dividends Are Cut?
The share accumulation rate may decline if the distribution is reduced. An investor should not assume that a falling price and a constant high payout will persist indefinitely.
Fundamental Risk
Companies facing declining earnings or excessive debt may be unable to maintain their payouts. Funds may also change distribution policies. A prudent projection should test lower distribution amounts rather than automatically assuming stability.
For decisions during declines, see buying during a correction and what to do during a correction. Correction durations and bear-market recovery times explain why purchasing more shares does not establish a recovery deadline.
Scenario Analysis: Dividend Cuts and Suspensions
Dividend reinvestment strategies depend on cash being distributed. But companies and funds may reduce or suspend payments.
A Dividend-Cut Example
Suppose a stock pays $1 annually. A 40% dividend cut reduces the payment to $0.60 per share. An investor holding 500 shares receives $300 rather than $500 annually. That reduces the amount available for reinvestment.
Share-Price Effects
Dividend cuts may coincide with deteriorating business conditions and lower share prices. However, the market’s reaction depends on expectations and other information.
Calculator Sensitivity Analysis
A more detailed simulator could allow a dividend cut beginning in a selected year—for example, stable distributions during Years 1–3, a 30% cut in Year 4, and no growth afterward. The calculator here instead applies a smooth annual distribution-change assumption after the first payment; it does not implement a dated cut or suspension schedule. Treat that limitation as a reason to test several assumptions rather than rely on one favorable result.
Why It Matters
A long-term strategy should remain financially realistic even when distribution expectations are not met.
Market warning signs, historical corrections, correction frequency and correction statistics offer context for stress tests. They do not predict the next dividend cut or price path.
How Reinvestment Changes Portfolio Income at Retirement
An investor may reinvest all distributions during an accumulation phase and later switch to receiving cash. This creates a transition from share accumulation to income use.
Accumulation Phase
Distributions are used to purchase additional shares. The objective is to build a larger investment position.
Income Phase
Distributions are paid into cash and may help finance living expenses.
The Transition
The investor can estimate potential future cash distributions based on projected shares and assumed distributions per share. However, those payments remain uncertain.
A Simple Example
Suppose an investor eventually owns 1,000 shares of a fund. If the fund distributes $0.25 monthly, the investor receives $250 per month. If it reduces the distribution to $0.15, the payment falls to $150 monthly. If the share price also declines, the investment’s capital value decreases.
Why Dividend Income Is Not a Guaranteed Retirement Plan
A reliable retirement assessment should consider other income sources, essential spending, taxes, liquidity reserves, and total portfolio risk. Dividend payments can be one component. They should not be treated as permanently guaranteed cash flows.
Our compounding and withdrawals workbook examines spending cash flows. Dividends spent on living expenses are no longer available for reinvestment; include the cash benefit when comparing strategies, while distinguishing it from wealth still held.
Reinvestment Strategy vs. Cash-Flow Strategy
Some investors seek maximum long-term total return. Others prioritize regular cash distributions. These objectives can overlap, but they are not identical.
Total-Return Objective
An investor seeking long-term wealth accumulation may reinvest distributions and periodically rebalance the portfolio.
Cash-Flow Objective
An investor seeking current income may retain distributions rather than reinvest them.
Hybrid Objective
An investor may reinvest part of the distribution and retain the remainder as cash. For example, half of each payment might be reinvested while half supports expenses.
Why the Objective Determines the Calculation
A calculator should not automatically interpret dividend spending as a failure. Using distributions for consumption may be the purpose of the investment. But a projection should show the resulting effect on share accumulation and ending portfolio value.
A Useful Comparison
The main calculator presents fractional reinvestment, whole-share reinvestment with cash carried forward, and no reinvestment with distributions retained as cash. It does not implement partial reinvestment. The three modes share the same fund price and per-share payout path, with no outside deposits. Their results differ because of investment exposure, purchase rounding and any reinvestment charges.
Dividends, Buybacks, and Capital Allocation
Companies can return capital to shareholders through more than one mechanism. Dividends distribute cash. Share repurchases reduce outstanding shares when completed and not offset by new issuance. Companies may also reinvest earnings in operations or reduce debt.
Why Dividends Are Not the Only Source of Shareholder Return
A company retaining earnings may create value by funding profitable investment projects. Another may generate substantial cash and return part of it through dividends. Neither approach is automatically superior.
Dividend Reinvestment Is an Investor Decision
When dividends are paid, the shareholder can decide how to allocate the cash, subject to plan and brokerage arrangements.
Company Reinvestment Is Different
When a company retains earnings and reinvests them in its business, the shareholder does not receive cash to purchase additional shares. The investment’s value may change as a result of business performance.
Why Capital Allocation Matters
A company paying an unsustainably high dividend may reduce financial flexibility. A company retaining every dollar may also invest poorly. Investors should examine the economic quality of capital allocation, not just whether cash is distributed.
How to Evaluate Dividend Sustainability
Before modeling twenty years of reinvested payments, investors should consider whether the underlying distributions are economically supportable.
Earnings
For individual companies, earnings can provide information about profitability. However, reported earnings and cash flow are not identical.
Free Cash Flow
Free cash flow can help assess the cash available after necessary capital expenditures, subject to the definition used.
Payout Ratio
A payout ratio compares distributions with a selected measure such as earnings or cash flow. Its interpretation depends on the industry.
Debt
Highly indebted companies may face competing demands for cash. Debt repayments and interest obligations can affect dividend capacity.
Business Stability
Companies with recurring demand and strong competitive positions may have more stable cash-generation characteristics. However, no company is immune from economic risk.
Fund-Level Distributions
For ETFs, investors should examine the distribution policy, underlying holdings, fund strategy, NAV history, and total return. A fund’s distribution rate should not be evaluated as though it were a company earnings yield.
For company analysis, compare how to read a stock, P/E ratios and PEG ratios. A favorable-looking income ratio should not replace analysis of the business and its obligations.
Common Dividend Reinvestment Mistakes
Treating Distributions as Free Money
A distribution generally transfers value from the investment to the shareholder.
Confusing Distribution Yield With Total Return
A fund can make large payments while generating weak or negative total returns.
Assuming Share Accumulation Guarantees Wealth Growth
More shares can be worth less if prices decline.
Ignoring Ex-Dividend Price Adjustments
A model that adds distributions without considering the corresponding transfer of fund value may overstate wealth.
Assuming Dividends Always Grow
Companies and funds can reduce or suspend payouts.
Ignoring Whole-Share Restrictions
Residual cash can prevent every distribution from being immediately reinvested.
Assuming Every ETF Offers Automatic DRIP
Eligibility and program rules vary across brokers and securities.
Ignoring Reinvestment Costs
Fees and spreads can reduce the amount actually invested.
Ignoring Taxes
Reinvested taxable dividends can still create tax obligations.
Overlooking Currency Conversion
Foreign-currency distributions may involve additional costs or exchange-rate exposure.
Double-Counting Total Returns
Adding dividend yield to an assumed total-return rate may produce artificially inflated projections.
Ignoring Portfolio Concentration
Repeated reinvestment into one security can increase exposure to that investment.
Applying Unrealistic Dividend Growth Rates
High dividend growth cannot continue indefinitely without sufficient underlying economic support.
Failing to Compare Total Wealth
Share count, cash income, and portfolio value should be assessed together.
Frequently Asked Questions
What Is a Dividend Reinvestment Calculator?
It is a tool that estimates how cash distributions may be used to acquire additional shares and how those purchases affect future share balances, income, and portfolio value under specified assumptions.
What Does DRIP Stand For?
DRIP stands for dividend reinvestment plan.
How Does Dividend Reinvestment Work?
Cash distributions from eligible investments are used to purchase additional shares rather than being paid out for spending or retained as cash.
Does DRIP Guarantee Higher Returns?
No. Reinvestment maintains or increases investment exposure, but actual returns depend on future asset performance.
Can Dividend Reinvestment Lose Money?
Yes. An investment can decline in value even as the share balance increases.
Why Does the Share Price Fall When a Dividend Is Paid?
All else equal, paying cash out of a company or fund reduces the economic value remaining in the investment. Actual market prices are also influenced by unrelated trading and information.
Does Reinvesting Dividends Create Free Shares?
No. Additional shares are purchased using distributed cash or through the specific terms of a reinvestment arrangement.
Is Dividend Reinvestment Better Than Taking Cash?
The answer depends on whether the investor prioritizes future investment exposure or current cash needs, along with investment risk and financial circumstances.
Do All Brokerages Support DRIP?
No. Eligibility and operational arrangements vary.
Can I Reinvest ETF Distributions?
Often, yes, but automatic reinvestment depends on the brokerage and the particular ETF.
What If My Account Allows Only Whole Shares?
Cash may need to accumulate until enough is available to purchase one or more whole shares.
Are Fractional Shares Important?
They allow smaller distributions to be deployed more completely, but fractional trading features and fees vary.
Is Dividend Growth Guaranteed?
No. Companies and funds may increase, reduce, suspend, or otherwise change distributions.
Can a High-Yield ETF Compound at Its Distribution Rate?
Not necessarily. Distribution yield is not equivalent to total return.
How Do Covered-Call ETFs Affect DRIP Calculations?
Their distributions and return profiles depend partly on options strategies, underlying holdings, and fund policies. High cash payments should not be assumed to represent sustainable compound growth.
What Is Return of Capital?
Return of capital is a distribution classification associated with amounts returned from invested capital under applicable reporting rules. Its tax and economic interpretation depends on the circumstances.
Are Reinvested Dividends Taxable?
They may be taxable in a taxable account, depending on jurisdiction and distribution classification, even when reinvested.
Does Dividend Reinvestment Increase My Cost Basis?
Reinvested purchases can create additional acquisition cost or adjusted cost-base records, subject to applicable tax rules.
Should I Reinvest Dividends During Retirement?
That depends on whether the cash is needed for living expenses, the investment’s suitability, and the broader retirement plan.
How Do I Calculate New Shares?
Divide the available reinvestment cash by the purchase price. For whole-share-only purchases, round down and track residual cash.
Can Dividend Reinvestment Increase Future Income?
Yes, additional shares may produce additional cash distributions if payments continue. However, the amount is not guaranteed.
What Is the Most Important Metric?
Total portfolio value and total return are essential. Share count and cash distributions provide useful supplementary information.
Reinvesting Dividends and Measuring Financial Progress
Dividend reinvestment is a practical method for using investment distributions to acquire additional shares. Over time, it can increase share ownership and potentially support future investment growth. The approach may be particularly useful for investors who do not need immediate cash income and wish to maintain exposure to their selected investments. However, reinvestment should not be confused with the creation of additional economic value at the moment of a distribution. The cash used to purchase new shares comes from the investment’s distribution. When a fund distributes cash, its net assets generally decline by the amount paid, all else equal. The shareholder can retain that cash or reinvest it.
The difference concerns subsequent exposure to investment returns. This distinction becomes especially important when evaluating high-distribution products. A fund may distribute substantial cash while experiencing declining share prices or net asset value. Reinvesting those distributions can increase the number of shares without guaranteeing growth in total wealth. A sound dividend strategy therefore needs more than an attractive yield. It should consider investment quality, payout sustainability, valuation, concentration, fund structure, fees, taxes, and the investor’s financial objectives. A well-designed calculator can make these relationships transparent.
It can show how share count changes after each reinvestment, how cash accumulates when fractional shares are unavailable, and how future values depend on changing prices and distributions. It can also demonstrate the consequences of dividend cuts, inflation, and reinvestment costs. For long-term investors, the principal benefit of reinvestment is that distributed capital remains invested and available to participate in future returns. For investors who need income, retaining and spending distributions may be appropriate. The better decision depends on the purpose of the money.
Explore the Earlier Academy Pillars
Connect dividend reinvestment with the nineteen earlier pillars on market behavior, economic conditions, investing methods and growth mathematics.
Continue Learning in the Invest & Compound Academy
Continue with performance measurement, compound growth, outside savings and ETF structure.
Dividend reinvestment, share accumulation and economic return
Market Correction Pillar | Indexes and Markets | Portfolio Construction
Sources and Further Reading
Reference review: October 19, 2026. Official sources support distribution mechanics, plan rules, fractional-share limitations and the cited U.S. basis principles. All numerical price, payout and reinvestment paths here are hypothetical mathematical scenarios. They are not historical fund performance, product quotes or forecasts. Calculator assumptions are displayed beside each tool.
- SEC Investor.gov: Fund Distributions — Investor Bulletin, August 19, 2026.
- SEC Investor.gov: Direct Investing — dividend reinvestment arrangements and plan fees.
- SEC Investor.gov: Fractional Share Investing — Buying a Slice Instead of the Whole Share, November 9, 2020.
- Internal Revenue Service: Dividend Reinvestment Plan Stock Basis — U.S. tax guidance, not Canadian tax advice.
- Canada Revenue Agency: Interest and Other Investment Income — foreign income reporting and Canadian-dollar conversion.
- SEC Investor.gov: Compound Interest Calculator — a separate general accumulation tool.
This article provides general financial education, not personalized investment, financial, tax or legal advice or a recommendation to buy, sell or hold a security.
Distributions, prices, investment returns and inflation are uncertain. Reinvestment does not guarantee profits or prevent losses. Distribution yield is not compound total return, and share accumulation does not guarantee wealth growth.
Taxes, costs, currency, account rules and transaction timing affect actual results. The tools simplify distributions and execution; they do not reproduce a particular broker’s DRIP, calculate jurisdiction-specific tax or establish distribution sustainability. Review official fund and brokerage documents before acting.